Pipelines, Athabascan Tar Sands, Petroleum in General, and the Laurentian Great Lakes: A Potentially Disastrous Combination
Written by Desmond Morista:
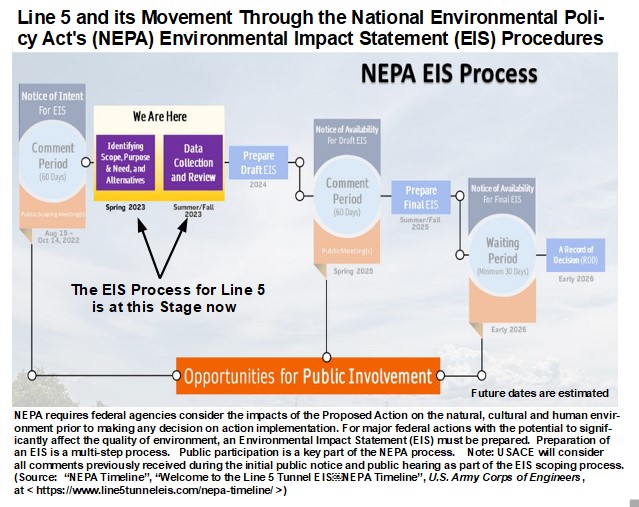
On January 3rd of this year, Collectivist Action posted an important article here at The Ongoing Class Struggle, that he found on TruthOut, posted on Dec 31, 2023, it is entitled “Controversial Line 5 Pipeline Gains Key Permit Despite Indigenous Opposition and Environmental Concerns: Enbridge Energy secures key permit to build a new section and tunnel underneath, sparking controversy and legal battles”, at < https://ongoingclassstruggle.blogspot.com/2024/01/controversial-line-5-pipeline-gains-key.html >. Truthout had republished an article originally posted on Grist, on Dec 20, 2023, under a different title, “Why more than 60 Indigenous nations oppose the Line 5 oil pipeline: The 70 year-old pipeline, which just won a key permit, poses ‘an unacceptable risk of an oil spill into the Great Lakes.’ ”, Dec 20, 2023, Anita Hofschneider, Grist, at < https://grist.org/indigenous/why-more-than-60-indigenous-nations-oppose-the-line-5-oil-pipeline/ >. The article points out that the proposed Line 5 Tunnel project had made a significant stride towards final approval and that the U.S. Army Corps of Engineers had, unsurprisingly, decided to grant a permit for the project. The process is far from over however, and at some point in the not-too-distant future, there will be more public meetings and another 60 day period to submit written comments.
NOTE: To Begin with this piece here below was a response to a short article that was posted here (at Leftist Politics) on March 12, 2021, that article was entitled: “OVER 350 GROUPS URGE PRESIDENT BIDEN TO STOP THE LINE 3 PIPELINE”, it was originally published on March 8, 2021, written by Collin Rees, Oil Change International, at < https://priceofoil.org/2021/03/08/letter-to-biden-line-3/ >, and subsequently republished by Popular Resistance, at < https://popularresistance.org/over-350-groups-urge-president-biden-to-stop-the-line-3-pipeline/ >.
The article mostly discussed the expressions of concern by a wide variety of Environmental Groups and Indigenous People’s Organizations and Tribal Councils, over the ominous news that work will now proceed on Line 3 in Minnesota. That article, from Popular Resistance, never even mentioned the Great Lakes. Line 3 was designed, and has been built, exclusively to transport Athabascan Tar Sands material (in the form of Diluted Bitumen, or DilBit) from the Fort MacMurray region of Alberta to Superior, Wisconsin, the neighbor and sister city of Duluth, Minnesota; the Duluth / Superior urban area is located at the far western end of Lake Superior.
At Superior, Wisconsin Line 3 connects to Lines 61 / 6A that farther south connect into Line 6B. Line 6B passes around the Chicago area and crosses Southern Lower Michigan eventually arriving at Port Huron, Michigan / Sarnia, Ontario where it crosses under the water of Lake Huron and in Sarnia it connects with Line 9. Line 9 passes from Sarnia on through Ontario to a location WNW of Montreal, Quebec. There is a connection there, with the Portland - Montreal Pipeline that carries the DilBit to a refinery in Portland Maine. That refinery cleans it up a bit more and then loads it onto Oil Tankers for transportation to World Markets.
Line 5’s route is along the south shore of Lake Superior, through Wisconsin and the far-western part of the Upper Peninsula of Michigan, then it passes through the interior part of the Upper Peninsula and finally goes south and crosses under the water of the Straits of Mackinac, where Lakes Michigan and Huron meet up. Then Line 5 crosses the Northeastern part of the Lower Peninsula arriving at Port Huron, Michigan / Sarnia, Ontario and feeds Line 9 in Ontario. Line 5, in earlier years, used to transport DilBit from Alberta, but is no longer used for that purpose; instead it transports a wide variety of oils, gasoline, and natural gas. The 70 year old pipeline that passes under the Lake Huron / Lake Michigan waters is clearly not up to transporting DilBit. It has a 50-year design life.
Either one, or both of those routes, could potentially cause a horrific spill debacle in the Great Lakes. Since I am originally from the Great Lakes area, I thought it would be useful to provide more background for our readers. Nothing is more important than some of the issues discussed by the various groups who petitioned President Biden about Line 3, or the issues discussed in the article below. Life itself is not possible without access to clean fresh water. The article is divided into 6 parts, it was written nearly three years ago..
Table of Contents
Pg. 5. Part 1: Water Resources of the Earth in General and the Importance of Lake Water.
Pg. 5. General Discussion of Fresh Water and its Various Attributes
Pg. 9. Can Harvesting Icebergs Play a Role in Resolving Critical Water Issues?
Pg. 11. Current and Ongoing Water Crises: Cape Town, South Africa, and other Major Cities
Pg. 14. Water Supply and Use Issues are Becoming More Critical and Contentious on a Global Scale.
Pg. 16. Part 2: General Water and Development Issues. Putting the North American Great Lakes Into Context.
Pg. 16. Lakes and Lake Systems of the World
Pg. 20. Political and Demographic Issues and the Great Lakes.
Pg. 23. North American Water Issues, Population Shifts, Infrastructural Subsidies and the Great Lakes
Pg. 24. Part 3: The Various Issues of the Great Lakes
Pg. 24. Exotic Species Problems in the Great Lakes
Pg. 29. General Environmental and Ecological Concerns About the North American Great Lakes System
Pg. 33. Part 4: The Petroleum Industry and the Great Lakes.
Pg. 33. Pipelines, the Athabascan Tar Sands, and the Great Lakes.
Pg. 36. Line 5: The Biggest Single Danger to the Great Lakes.
Pg. 40. The State of Michigan Finally Acts
Pg. 41. Enbridge: Line 6B and the Disastrous 2010 Pipeline Rupture at Marshall, Michigan
Pg. 46. Consequences of the Line 6B Rupture and Spill
Pg. 48. Some Photographs of the Disaster
Pg. 52. Enbridge Pipeline 6B System After the Marshall Oil Spill.
Pg. 54. Pipelines - Pipelines, so many Pipelines!!
Pg. 57. Part 5: Other Pipeline Projects Being Built, or Proposed, to Move Athabascan Tar Sands Bitumen
Pg. 57. Pipelines to the West, To Reach Pacific Oil Terminals
Pg. 57. Pipelines to the South, To Reach Gulf Coast Refineries and Oil Terminals
Pg. 58. The Larger North American Pipeline System and the Centrality of the Athabascan Tar Sands of Alberta, Canada
Pg. 65. Part 6: The Great Lakes in the Larger Oil Picture. The Lakehead Pipelines and the Potential Stranding of the Athabascan Tar Sands.
Pg. 66. Discussion of various Pipelines and proposed pipelines in North America, specifically with regards to Athabascan Tar Sands and its transport.
Pg. 70. Conclusions.
Pg. 75. Glossary.
Pg. 76. References.
Part 1: Water Resources of the Earth in General and the Importance of Lake Water
The overall water resources of the Earth are very large, but the overwhelming majority of the water is salty water that is not usable for most important human and land animal needs. The 2.6% of overall water that is fresh water is frequently inaccessible. Fresh water sources are either located far from where most people actually live, are difficult to access, are contaminated already, or are fully exploited and often are being depleted. Figure 1 is a bar chart of the total amount of water, salty and fresh, that is available for use on the face of the earth.
Figure 1: Bar Chart of How the Earth’s Water is Distributed.
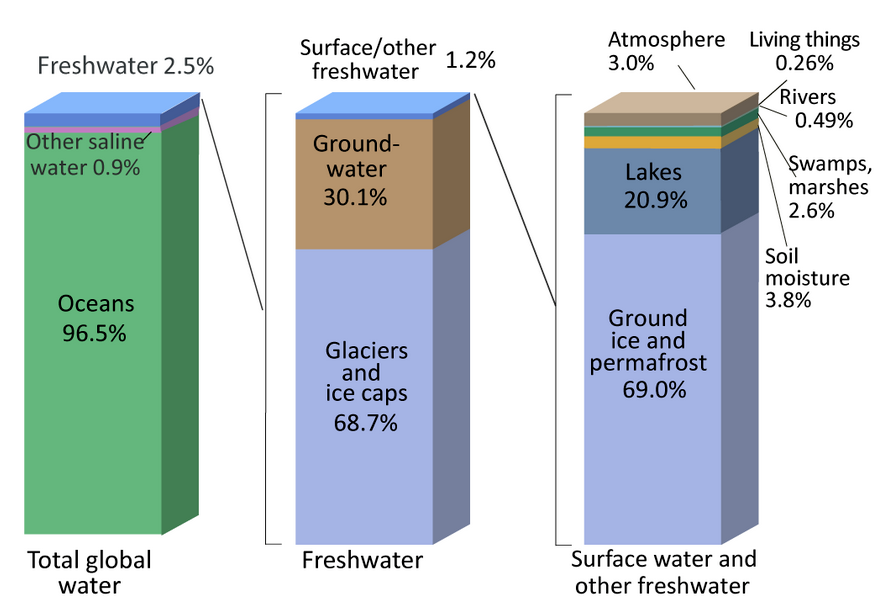
(Figure 1 source: “Where is Earth's Water?”, USGS, at < https://www.usgs.gov/special-topic/water-science-school/science/where-earths-water?qt-science_center_objects=0#qt-science_center_objects >: Original source: Igor Shiklomanov’s Chapter “World Freshwater Resources”, in Peter H. Gleick, ed., 1993, Water in Crisis: A Guide to the World’s Freshwater Resources)
To understand Figure 1 we must realize that the leftmost bar of the graph, Total Global Water, demonstrates that 97.4% of all the water on Earth is Salt Water. Then the middle bar, Freshwater, shows that of the remaining 2.6% of all the water (from the little blue slice at the top of the Total Global Water bar that is labeled Freshwater 2.5%), 68.7% is in Glaciers and Ice Caps, 30.1% is in groundwater, and only 1.2% is in surface freshwater (0.026 x 0.012 = 0.000624 or 0.0624% of all the Earth’s water is fresh surface water). The rightmost bar, Surface Water and Other Freshwater, shows that of Surface Freshwater that makes up 0.0624% of the Earth’s total water; only 20.9% of that is in lakes, or just 0.013% of the total water of the earth is in freshwater lakes. The rivers of the world contain only 1/21st of that amount, or 2.34%, of the amount of freshwater that freshwater lakes hold.1
The traditional figures report that the lakes of the world contain a total of about 91,000 km3 of freshwater, and that of the three “Great Lakes Systems ” (North American Great Lakes, African Great Lakes, and Lake Baikal) hold about 77,286.4 km3 or 84.5% of all lake freshwater. In addition 17 other really large lakes hold an additional 14,135 km3 of freshwater. When we add 77,286.4 km3 and 14,135 km3 we get 91,421.4 km3. That is to say that the 32 largest freshwater lakes on Earth hold nearly all the freshwater found in lakes.2
But there is a relatively recent Geographic Analysis that comes to a significantly different conclusion as to the distribution of lake waters. It is based on a complex mathematical geographic analysis and recent satellite data. That analysis does not discriminate between saltwater and freshwater lakes, but their work points out that the 10 largest lakes on Earth hold 83.65% of all lakewater, salt and fresh, in lakes over 1 hectare of surface area. And that the 18 largest lakes on Earth hold 86.28% of all lakewater, salt and fresh, in lakes over 1 hectare of surface area. By factoring out saltwater lakes, I found that by their figures the largest 15 Freshwater lakes hold about 75.79% of the water in all freshwater lakes over 1 hectare of surface area. The top 125 Freshwater Lakes hold about 85.24% of the water in all freshwater lakes over 1 hectare of surface area. In contrast the Total Water Volume for the rest of the world’s lakes: the 1,420,920 Lakes of less than 1,000 hectares of surface area, is 14,100 km3. This amounts to 13.71% of all the freshwater contained in freshwater lakes worldwide. So while the fact that the largest lakes contain a great majority of all lake freshwater the relationship is not as lopsided as traditional figures reported.3
Relatively recent satellite image analysis has indicated that there are a total of 117 million lakes on the surface of the Earth and that 1.4 million of them have surface areas of 10 hectares (24.71 acres) or more. The non-glaciated surface of the Earth is almost 4% covered by lakes. The great majority of the many small lakes on Earth are found in Canada, Scandinavia, and Siberia. But the fact remains that the proportion of the Earth’s water that is contained in the smaller lakes is vanishingly small. And the amount of freshwater in rivers is a really tiny 0.000153% of all water (or just 2.34% of what is found in freshwater lakes), and well over half of that amount is in the Amazon, the Orinoco, the Parana and Iguazu Rivers of South America. Nonetheless rivers are a major source for drinking, irrigation, and industrial water uses. Nonetheless we must understand that the amount of water in Rivers is a snapshot, the flow of water through the rivers makes them effectively more significant, but the actual amount of water available in rivers is limited.4
Map 1, here below, demonstrates for lakes the relentless fact that most of the world’s freshwater resources are located in places where very few, or no, people live. The greatest Lake District of the world is in Northeastern Canada. The celebrated lake states of the U.S. such as Minnesota “the land of 10,000 lakes” are at the southern end of the major lake district and only contain a relatively small number of lakes. Actually the U.S. is relatively well endowed with lakes, it has the third largest collection, with about 102,500 lakes. Canada is first with about 879,800 and Russia is second with about 201,200. The lake abundance then falls off dramatically, with 4th most well endowed China, that has approximately 23,800 lakes. Keep in mind that these figures are for numbers of lakes with a surface area of 10 hectares and larger that total up to about 1,420,920 lakes. For the figure of 117 million total lakes, heavily weighted toward small lakes under 10 hectares surface area, the figures are probably around 70 - 80 million lakes or more in Canada, with significant if smaller distributions in Russia, Scandinavia, and the U.S. 5
Map 1: Lakes of Over 10 Hectares Surface Area as Distributed Around the World
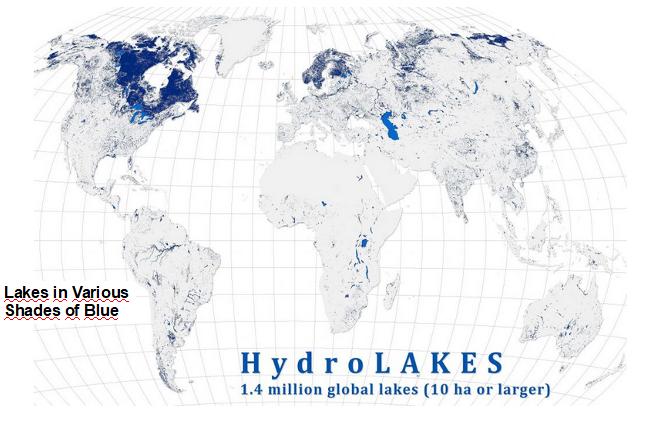
(Map 1 Source: “HydroLAKES: Global database of all lakes with a size of at least 10 ha”, 2016, anon., Global HydroLAB, Department of Geography, McGill University, at < http://wp.geog.mcgill.ca/hydrolab/hydrolakes/ >)
Can Harvesting Icebergs Play a Role in Resolving Critical Water Issues?
It would appear that the best option for desert cities, or other areas that want to obtain freshwater supplies, might be to tow icebergs that have broken away from Greenland or Antarctica. That would enable those places to recover that freshwater that, with the increasing warming of the Earth and the retreat of the ice sheets on Greenland and Antarctica, are moving into the Oceans and melting there at an increasing rate. At least a significant proportion of that freshwater could be recovered by towing the icebergs to places that need freshwater supplies. This method was considered by various scientists, engineers, commissions and politicians, at numerous times during the past; including by Saudi Arabia back in the 1970s. This process would perhaps be viable for various other dry places, that have the financial and technological wherewithal to actually accomplish such a feat.6
Every year more glacial ice breaks off into the oceans than the total human usage of water. Is it possible to actually accomplish the use of icebergs? If it is, then first it would be possible to move icebergs to places in the Southern Hemisphere like Australia and South Africa. It turns out that the very nature of the ice in the icebergs from Antarctica is different from, and more conducive to, successfully moving icebergs than is that of Arctic / Greenland icebergs. Antarctic iceberg ice is colder, denser and more laminar than is that of the icebergs in the Northern Hemisphere. It would only be possible to move icebergs long distances by using the currents to provide most of the energy to move the icebergs, and the main work of powerful tugs would be to steer a given iceberg into a given current. For icebergs generated in Antarctica the Benguela Current provides the energy needed to assist in moving them northward towards Africa. Many critics claim that it will never be possible to successfully move a major iceberg from the Southern Hemisphere, across the equator to any destination in the Northern Hemisphere. There are also many skeptics who point out that the Carbon footprint of a major iceberg towing / moving operation would be massive. The great majority of the world’s people live in the Northern Hemisphere and there are many places in the Northern Hemisphere that could make use of iceberg water. The icebergs of the Arctic / Greenland area are not as favorable for towing / moving as the Antarctic icebergs are; but there have been serious proposals to move them, including one to move an iceberg from Greenland to the Canary Islands off the coast of Africa. Harvesting icebergs is worth a serious new look as the alternatives, continued surface water development and transfer, ground water usage, desalination, and improved water efficiency and reuse efforts all have limitations.7
Serious water issues that we certainly face on a global basis, require innovative and serious solutions. Maybe what is needed is an international effort, that would build a fleet of nuclear powered heavy tugs specifically designed to move icebergs. If those tugs worked for years towing and guiding icebergs the carbon footprint involved in the manufacturing of a dedicated purpose built fleet of tugs would be minimal when compared to the good their work could do. A small fraction of the money spent on war, prisons, and repression could easily fund such a venture. And it would be far cheaper and more humane to provide water, and build the infrastructure to distribute it, to the poor places in the Global South with water shortage problems, than it is to continue to battle the ongoing migration flows. Adequate water, to live a wholesome life, would be a big start towards reducing the push factors that propel many migrants to leave their homes.
Current and Ongoing Water Crises: Cape Town, South Africa and other Major Cities
Capetown, South Africa came very close to running out of water in the period from 2017 to 2018, and was finally saved by heavy rains over its reservoir system. Poor water management and even the closing of an operational desalination plant in 2011 were major contributors. While Capetown is the first major city to come within a few days of running out of water; many other cities in various places around the world have serious water trouble as well. Barcelona, Spain almost ran out of water in 2008, Sao Paulo, Brazil is continually on the brink of severe water shortages. Chennai, Tamil Nadu, India; a metropolitan area with a population of 11 million, and the main center of motor vehicle production in India, came just as close to running out of water in 2019 as Cape Town did in 2017 - 2018. Chennai is not even in a semi-arid or arid climatic zone, but generally gets a surfeit of rain every year from the monsoon rains. Those have become somewhat less reliable, and failed to amount to much in 2019. But poor water management, and speculative water business operations by the well off who drilled deep wells to sell the ground water for tidy profits, also played a major role in the Chennai water crisis. Australia is the hottest and driest of the Earth’s continents and suffers from increasing droughts and water crises. While the water supplies of Australia’s major cities have not been depleted like those of Cape Town or Chennai, there is an ongoing rural water crisis in Australia. And while climate change and serious drought play a major role in Australia the marketization and monetization of water in Australia also played a significant part in Australia’s rural water crisis.8
Figure 2 shows the fluctuating amounts of water stored in Capetown’s 6 reservoirs. The very lowest point actually occurred in June / July 2017 but rains then filled the reservoirs to about 35% of capacity, then in May / June 2018 fell nearly as low as in 2017 but the situation was saved by timely rains and the reservoirs filled to around 70% of capacity. But the increasing problem of drought still threatens Cape Town. The surrounding agricultural region uses approximately as much water as the city does, that seems unlikely to remain viable if the urban area continues to rely on the dam and reservoir system.
Figure 2: The Water Crisis in Cape Town, South Africa. 2017 - 2018
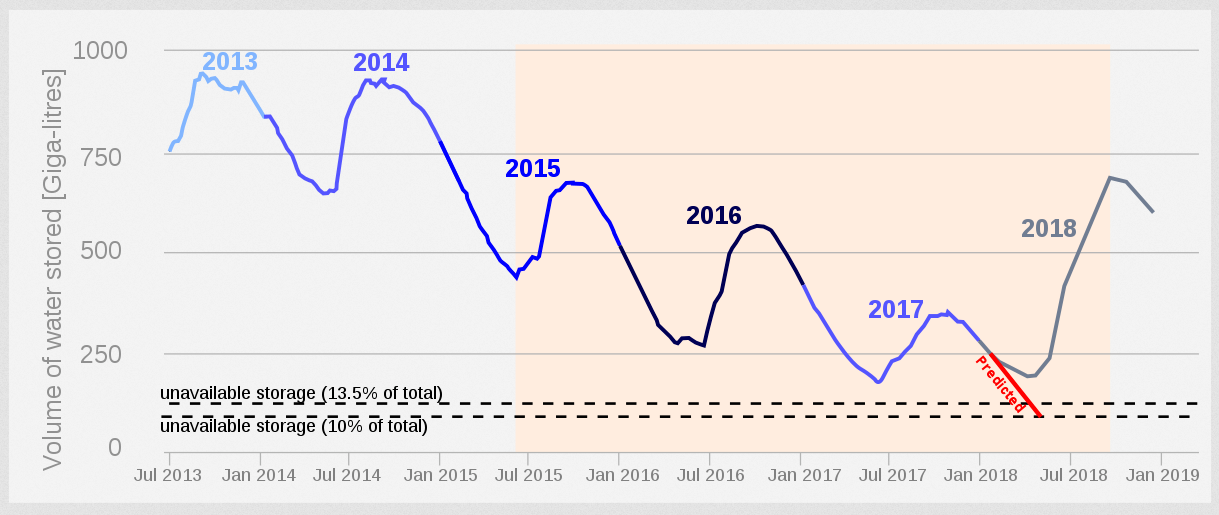
(Figure 2 source: “Graph of total water stored in the Western Cape's largest six dams from 30 June 2013 to 31 March 2019.”, at < : https://upload.wikimedia.org/wikipedia/commons/thumb/8/83/Cape_Town_water_graph_Jan_2018.svg/1280px-Cape_Town_water_graph_Jan_2018.svg.png >: Original source: “Graph of the total water stored in the Western Cape's largest six dams from 30 June 2013 to the 15 January 2018. The graph illustrates the declining water storage levels over the course of the Cape Town water crisis. Data obtained from the Climate Systems Analysis Group (SAGP)”, 25 January 2018, Discott, at < https://commons.wikimedia.org/wiki/File:Cape_Town_water_graph_Jan_2018.svg >.)
Figure 3, below, adds a bit more complexity to the situation in Cape Town. The region near Cape Town is a “Mediterranean climatic zone”. It resembles California, parts of Australia, parts of Chile, and of course the largest example of this sort of climate, the lands that border on the Mediterranean Sea and the Black Sea. These are regions where many crops including grapes, olives, and many other fruits and vegetables can be grown, if there is sufficient water. So superimposed over a similar graph of Reservoir storage are urban and agricultural usage amounts and rainfall. Here we see a relatively consistent situation, there is enough water for the urban needs of Cape Town, even during the drought period, but there is not enough water to also provide irrigation water for the agricultural interests. Like all Mediterranean climatic zone places the great majority of the rain in the Cape Town area falls during the winter. Summers, the growing season, are dry and the agricultural operations in the Cape Town area are dependent on obtaining irrigation water from the Western Cape Water Supply System (WCWSS) reservoirs during the growing season. This has become a serious problem in large parts of all the Mediterranean climatic zone agricultural regions. These areas play a major role providing fresh fruits and vegetables to the people in those places and also exporting those products to other areas. The population of the Earth needs to eat and places that use irrigation to produce food are important food production regions. However many of them are running up against serious, even fatal supply and allocation problems.
Figure 3: Cape Town, South Africa. Water Storage, Rainfall, and Urban and Agricultural Water Usage, 2008 - 2020

(Figure 3 source: “Big six Monitor”, Climate System Analysis Group, at < https://cip.csag.uct.ac.za/monitoring/bigsix.html >)
Water Supply and Use Issues are Becoming More Critical and Contentious on a Global Scale
An ominous sign for developments in water policy in the U.S. is that in December of 2020 the New York Stock Exchange introduced a market for the buying and selling of water, water rights, and water futures; the first time that has happened in the U.S. Australia introduced water markets into its stock market a few years ago and the results have been nothing short of disastrous. European speculators and stock jobbers who want to introduce water markets in Europe have run up against stiff oppostion.9 The most infamous example of the introduction of “market rates” for water occurred in Bolivia. Beginning in 1985 and continuing on through 1990s the Bolivian Ruling class cooperated with the World Bank and the International Monetary Fund (IMF) in selling off many of the publicly owned institutions in Bolivia to private investors. This was done to comply with the Structural Adjustment policies enforced by the World Bank and the IMF in fact as one author notes: “The World Bank warmly calls Bolivia an ‘early adjuster.’ Other poor, indebted countries have had to be forced to accept structural adjustment, but in Bolivia the World Bank and the I.M.F. have enjoyed a deep understanding with successive governments since 1985. Public enterprises -- the railways, the telephone system, the national airlines, the great tin mines of Oruro and Potosi -- have been sold, mainly to foreign investors. (This fire sale goes on: a Bolivian government Web site lists dozens of factories, refineries, cement plants, paper mills, and municipal utilities that are still available.) {the “fire sale” information cited here was as of 2002 the date of the article} 10
“In 1997, the World Bank forced the Bolivian government to privatize its water system in the city of Cochabamba as a condition for a loan package. Cochabamba is Bolivia’s third most important city, with a population of 600,000 people. After two years, in 1999, in a secret ballot in the Fall, the Bolivian government approved Law 2029 that gave the monopoly of water resources to the international consortium Aguas del Tunari, led by the American company Bechtel, the Spanish Abengoa, and four Bolivian companies as shareholders. The law was so abusive that in its Article 76, it did not allow the people of Cochabamba to collect water of cisterns or water from rain without a license.” (Emphasis added)
Another related law even allowed the incoming water consortium to charge people for using water from local wells.11
After the Bolivian government obligingly took care of the legal details in 1999 the business consortium dominated by the American Corporation Bechtel bought SEMAPA, the publicly owned water supply company for the Cochabamba, Bolivia area. They raised water rates significantly and cut off large numbers of people who had paid their water bills. In early January 2000 demonstrations with tens of thousands of indigenous people took place in Central Cochabamba, these resulted in battles with police and during the extended struggle one person was killed and many were injured. Later: “Protesters halted Cochabamba's economy by holding a general strike that shut down the city for four days. A ministerial delegation went to Cochabamba and agreed to roll back the water rates; still the demonstration continued. On 4 February 2000, thousands marching in protest were met by troops and law enforcement from Oruro and La Paz. Two days of clashes occurred with the police using teargas. Almost 200 demonstrators were arrested; 70 protesters and 51 policemen were injured. ... {The struggle continued on and, dm} In April 2000, demonstrators again took over Cochabamba's central plaza. When the leaders of the Coordinadora (including Óscar Olivera) went to a meeting with the governor at his office they were arrested. … The demonstrations spread quickly to other areas including La Paz, Oruro, and Potosí as well as rural areas. The protesters also expanded their demands calling on the government to resolve unemployment and other economic problems. Soon demonstrators had most of the major highways in Bolivia barricaded.”12 By April 10 the Bolivian Government agreed to require Bechtel to relinquish its control of SEMAPA and the privatization move came to an end. The were certainly problems and deficiencies in the SEMAPA water supply operation, but the people of Cochabamba clearly demonstrated that the exactions of foreign corporations would not be tolerated.13
The full name of the Cochabamaba people’s water rights protection organization was the Coordinadora de Defensa del Agua y de la Vida: that translates roughly to Coalition for the Defense of Water and Life. A year and a half after the April 2000 victory by the Coordinadora, Bechtel and the other members of Aguas del Tunari tried to collect $25 million by filing a case with “the International Centre for Settlement of Investment Disputes … an arbitration body created by the World Bank in 1966”. That effort ended when Bechtel and Abengoa were afflicted by constant protests, bad publicity, and constant demands in a worldwide campaign.To some degree inspired by the events in Cochabamba in the 15 years following the Cochabamba Water Struggle “... 235 cities in 37 countries have brought water services back under public control benefiting 100 million people worldwide.”14
Part 2: General Water and Development Issues. Putting the North American Great Lakes Into Context.
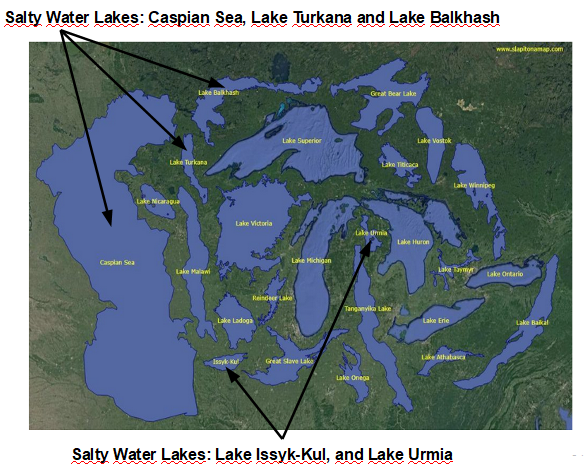
Map 1 below is a collage of the 25 largest lakes, by surface area, on Earth superimposed on a map of the North American Great Lakes region. It serves the purpose of demonstrating the relative place of the North American Great Lakes in the hierarchy of large lakes on the Earth. It should be noted that 5 of the 25 in Map 1, including the largest Lake on Earth, The Caspian Sea, are salty. The other 4 salt water lakes in the map are; Lake Balkhash, 15th largest in Kazakhstan; Lake Turkana, 21st largest in Kenya, Ethiopia (and part of the African Great Lakes System); Lake Issyk-Kul, 22nd largest in Kyrgyzstan; and Lake Urmia, 24th largest located in Iran. The Caspian Sea, with a water volume of 78,200 km3, contains just somewhat less water volume than all the Freshwater lakes on the Earth; that have a total volume of about 91,000 km3.
Map 2: The 25 Largest Lakes on Earth, by Surface Area. Superimposed on the Great Lakes of North America Region
(Map 2 source: “Largest Lakes in the World by Area”, Map: “World’s 25 Largest Lakes, by Area”, Vivid Maps, at < https://vividmaps.com/largest-lakes-by-area/ >)
The United States and Canada share one of greatest freshwater resources on Earth, the Laurentian Great Lakes of North America (hereafter the Great Lakes), a system of 5 major and one minor lake and with a river system that drains those lakes to the Atlantic Ocean, through Canada via the St. Lawrence River. Map 2 below provides a look at the 5 Lakes and their Watersheds (called Drainage Basins in the Map). This system, with a total water volume of 22,671km3, or 5,439 miles3, (measured at the low water datum) contains 97% of North America’s Surface Freshwater and 25% of the entire planet’s Surface Freshwater (this is discussed at greater length below in a quote from Maude Barlow in the section “General Concerns About the North American Great Lakes System”). To put the significance of the Great Lakes into context; it is one of only three freshwater Lake Systems of similar size and importance on the Earth. One of the other two being Lake Baikal in Russia (that with 23,615.39 km3, or 5,670 miles3, of fresh water contains more freshwater than all 5 Great Lakes in one single very deep lake). The other large freshwater system is the Great Lakes of Africa, and they are the largest system of major freshwater lakes on Earth in terms of water volume. They consist of an overall system that includes a total of 10 lakes. Collectively, they contain 31,000 km3, or 7,400 miles3, of water. The three largest of the African Great Lakes, Lake Tanganyika, Lake Malawi, and Lake Victoria combined hold 29,325 km3, or 7,035.45 mi3, of water, and each of those three is included among the top 10 freshwater lakes worldwide, ranked by water volume (See Map 1 above and Map 2 below).15 The North American Great Lakes have the smallest volume of water of the 3 Great Lakes systems, but have the largest surface area (245,000 km2 vs 160,299 km2 for the African Great Lakes, and 31,500 km2 for Lake Baikal) and amount of shoreline (16,692.5 km vs 9,018 km for the African Great Lakes, and 2101 km for Lake Baikal), of the 3 systems. The Laurentian Great Lakes were located in a place that served the development of U.S. industry, trade, and commerce during the greatest period of growth that occurred in the U.S. and Canada. Lake Baikal is in a remote region far from the core of Russian civilization. The African Great Lakes are located in a climatologically moderated upland area of tropical East Africa. Unfortunately Lake Baikal, and the Great Lakes of Africa, along with the North American Great Lakes, also have significant water quality issues. Any human activity that degrades any of these irreplaceable resources is, in a word, unacceptable; and must be stopped immediately. Allowing the transportation, storage, or processing of oil, or any other toxic or radioactive substance, near or across any of these lakes are unbelievably poor decisions that cannot be justified under any circumstances.
Map 3: The Three Great Lake Systems of the World
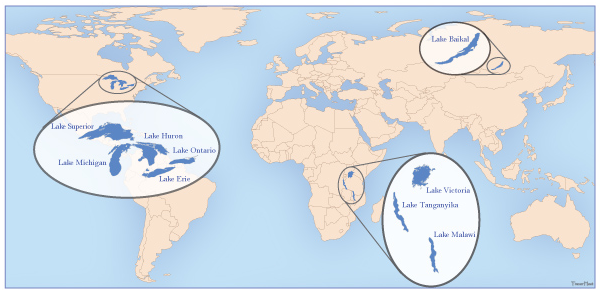
(Map 3 source: Great Lakes Index, Global Great Lakes, at < https://www.globalgreatlakes.org/index.html >)
The North American Great Lakes and their immediate watersheds are located in the North Eastern Quadrant of the United States and the SouthEastern region of Canada.(See Map 3 below).
Political and Demographic Issues and the Great Lakes
Over the last 40+ years, the area has suffered first relative and then later absolute levels of socioeconomic and political decline. This has taken place in both the U.S. and in Canada; though the situation is far more severe in the U.S. Nonetheless this part of the United States stands in a unique position in a country that is, for the first time, really beginning to experience limitations to the economic operations of its ruling Capitalist Class, based on water availability and water quality. In contrast with the dearth of infrastructural investment in the Great Lakes region, the U.S. Federal Government invested huge amounts of money and resources in the extensive system of dams and reservoirs in the Mountain West. However, that water impoundment and control system, largely built during the 1930s - 1979s, is starting to have problems, mostly because of low snowfall amounts in the winters. Water supply is becoming a more serious issue in the Western U.S., as well as in Texas. Other parts of the U.S. also face both water supply and water quality issues. Some members of the ruling class in those other parts of the country, mostly in the Southwest, argue that with the relative decline of the Great Lakes region the water in the Great Lakes should be transferred to their respective areas; largely to fuel more rounds of their endless wealth accumulation schemes via real estate speculation.16
Map 4: The Combined Great Lakes and Their Watersheds (Drainage Basins)
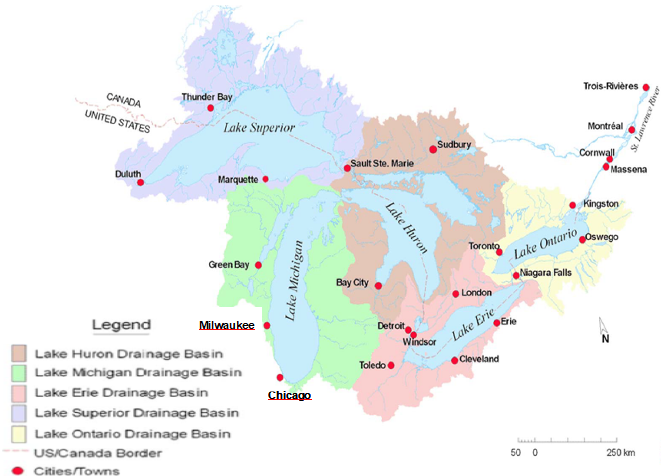
(Map 4 source: “Great Lakes Watershed Floor Map Lesson Nov2016.pub”, pg 6, Great Lakes Research Center, Michigan Technological University, “GM Ride the Waves Program”)
The facts that such a project would consume huge amounts of materials, would require massive amounts of electricity to pump the water over the mountains, and would be stoutly resisted on various levels in the Great Lakes region are all ignored. This specter of an attempt by the parched Southwest, or some other area, to take water from the Great Lakes, has already met with very determined resistance in the Great Lakes Region. In 2001 three billboards were erected in Michigan, by Citizens for Michigan's Future, that demonstrated the attitude of most Great Lakes people to any water diversion schemes, it is posted here as Figure 1 below. Notably neither figures representing Arizona nor Nevada appear on the Billboard. Now, 21 years after the billboard appeared, Arizona has two major metro areas Phoenix with a population of 4,584,000 and Tucson with 993,000, and even the Yuma Metro area has a population of 218,137. Nevada has the Las Vegas metro area with a population of 2,772,000 and the Reno area with 514,000; in addition there are 929,000 people living in the Albuquerque, New Mexico area, and 1,180,000 people living in the Salt Lake City area. These are all rapidly growing desert cities that must be added to the California urban areas of greater Los Angeles with a population of 15,728,800 and San Diego with 3,272,000. In fact, the population of the 8 counties of Southern California was 22,688,990 in 2021. The total population in the Thirsty SW comes to 38,858,990 people living in the 8 counties of Southern California (22.7 million), plus the 2021 population of the states of Arizona (7.55 million), Nevada (3.2 million), Utah (3.34 million), and New Mexico (2.1 million). Three of the SW desert states discussed above are part of the list of the 4 fastest growing states in the country. That list consists of: “Idaho, Nevada, Arizona and Utah topping the list of states with the highest percentage increase in residents from 2018 to 2019, according to the U.S. Census Bureau.”17 The population of this relatively dry and hot area, that has some parts that are still growing vigorously, is about equivalent to the 40 million people who live in the area around the Great Lakes, in both the 8 U.S. Great Lakes States and the two Provinces of Canada that have Great Lakes shoreline.
The future of water needs in a hotter drier North America will require serious changes in water management practices. “... transfers from irrigated agriculture probably will be needed and could be substantial. … climate change and population growth are likely to present serious challenges in some regions of the U.S., notably the central and southern Great Plains, the Southwest and central Rocky Mountain States, and California, and also some areas in the South (especially Florida) and Midwest.”18 All of the fastest growing states are in one or the other of these regions.
And this discussion so far does not even consider what is potentially the most dangerous state of all, to the integrity of the waters of the Great Lakes, Texas. Texas has a total state population of 29.8 million and has some serious water supply issues. In general the eastern part of Texas has adequate water and most of its water supply deficiencies can be solved with more conventional measures. But there are already several towns and some medium-sized cities with serious water problems, particularly in West Texas where there is not much water available. Texas’ economic and political players, working along with Enbridge, are fully capable of building major pipeline projects and the energy issues would not be anywhere near as daunting as there are no mountains to cross. There are people among the Texas elites eyeing the waters of the Great Lakes.
Figure 4: “Back Off Suckers”, a Billboard From Michigan in 2001
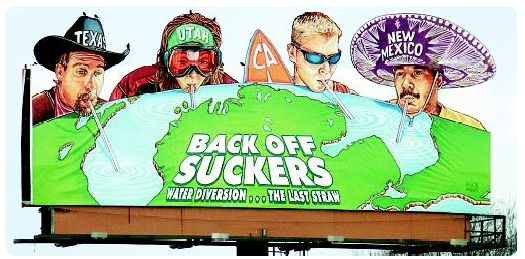
(Figure 4 source: “Great Lakes”, Diversion of Great Lakes Waters / Future of the Great Lakes, Water Encyclopedia, at < http://www.waterencyclopedia.com/Ge-Hy/Great-Lakes.html >)
North American Water Issues, Population Shifts, Infrastructural Subsidies and the Great Lakes
Only rarely is the fact mentioned that the rapid growth of the urban areas of the Southwest was subsidized by numerous types of Federal expenditures and subsidies. All the while none of the economic forces, who benefitted massively from that urban growth, ever questioned the long term viability of massive development and population increases in these desert regions. The simple fact is that agriculture accounts for about 80% of water usage in the Southwestern U.S. There is actually enough water to support the millions of urbanites there, given that they acknowledge that they are living in desert communities and change their way of life to reflect that fact (a process that is already well under way). What will have to change is the size of agribusiness operations in that part of the U.S. That will have serious effects on the production of fresh fruits and vegetables for the entire U.S., but that is the consequence of the shift of population and global warming. Transferring the water out of the Great Lakes would only, at best, postpone the day of reckoning when those decisions will have to be made; and would devastate the Great Lakes region in the bargain. It is not a viable option.
Jennifer Granholm, when she was Governor of Michigan, led an effort to establish “The Great Lakes – St. Lawrence River Basin Water Resources Compact'', to protect the Great Lakes water from being pilfered, it was agreed to by all 8 states involved, and it was ratified by the Congress and signed into law by President George W. Bush on October 8, 2008. A very similar parallel agreement was ratified by the Candian provinces of Ontario and Quebec Granholm, and other political officials in the Great Lakes States well knew that, the ongoing process of population increase in the South and West, was eroding the Great Lakes States ability to protect the water in the Great Lakes from a major transfer to other parts of the country.19 The protection afforded by the Compact is limited and we can expect renewed attempts in the future to take the Great Lakes water and transfer it to various places in the Sunbelt. This would likely be done under the cover of a “national emergency” or water shortage debacle of some sort somewhere in the Sunbelt states.
Nonetheless, there are already serious issues with water levels in the Great Lakes. The most serious situation for water levels is in Lake Michigan, where groundwater levels in some areas have fallen 1,000 feet. Lake Michigan, that like the other lakes was previously fed water by ground water strata, is now losing water from the Lake into the surrounding ground water. Also the Chicago River had its flow reversed, from emptying into Lake Michigan to emptying towards the Mississippi River, because of sewage, disease, and pollution problems. That began in 1900 and a considerable amount of water now flows out of the Lake Michigan watershed into the Mississippi River Watershed as a result. The Great Lakes also have other contamination problems, many left over from the region’s over a century long period of massive industrial production.
Part 3: The Various Issues of the Great Lakes
Exotic Species Problems in the Great Lakes
The lakes also have a serious and growing problem with the introduction of exotic species. The first major exotic species to enter the Great Lakes was the Sea Lamprey, it caused drastic unfavorable changes in the Lakes: “Sea lampreys are native to the Atlantic Ocean. In the 1800s sea lampreys entered into the Great Lakes system via manmade locks and shipping canals. Sea lampreys were first observed in Lake Ontario in the 1830s. Niagara Falls served as a natural barrier preventing sea lampreys from entering the other Great Lakes, but modifications to the Welland Canal in the early 1900s provided sea lampreys a path to invade the other lakes. In 1921 sea lampreys were first observed in Lake Erie and quickly spread into Lakes Michigan, Huron and Superior.”20 The last of the Great Lakes to be invaded by the Sea Lamprey was Lake Superior, where they were first observed in 1939. To date the Sea Lampreys were the worst exotic invader of the lakes, but they are now under fairly effective control, the result of a vigorous ongoing effort. A timeline for the Lamprey notes that:
“1835 – Sea Lamprey are documented in Lake Ontario
In the 1880s, sea lamprey populations increased in Lake Ontario, in part because the increased water temperatures in streams (a result of environmental changes) were better suited for sea lamprey reproduction. Sea lampreys parasitically feed on lake trout and other fish, causing populations of these species to decline in Lake Ontario.
1921 - Sea Lamprey discovered in Lake Erie
1936 and 1937 – Sea Lamprey discovered in Lakes Michigan and Huron, respectively
1939 – Sea Lamprey discovered in Lake Superior
1954 – The International Convention on Great Lakes Fisheries establishes the Great Lakes Fishery Commission, partially to focus on Sea Lamprey control.
The effects of the sea lamprey worsened in the 1950s until the first control efforts with lampricides began in 1958.”21
Thus we see that achieving a positive outcome to a serious environmental challenge took nearly 40 years of serious scientific and political efforts, to see the first positive results. Unfortunately the lakes, and other inland freshwater ecosystems in North America now face numerous invasive exotic species, that are affecting all the freshwater systems of North America, including the lakes, simultaneously.22
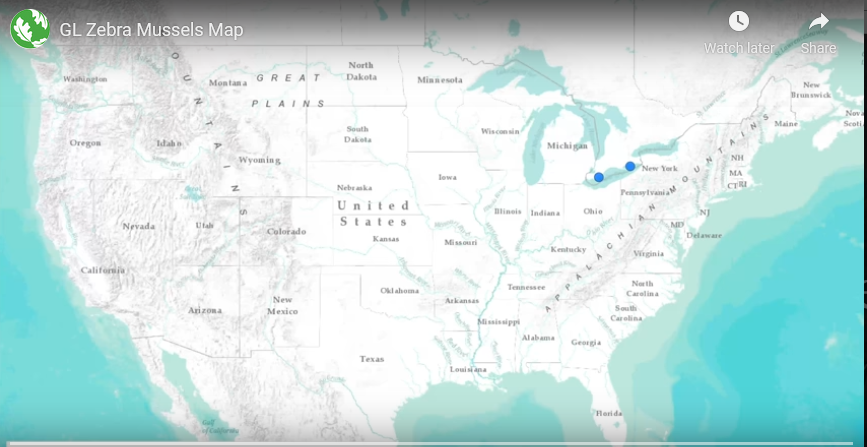
A more recent exotic species invader is the Zebra Mussel, that has seriously changed the ecological balance of the Lakes over the last 30 years, (and have spread throughout much of the U.S. as well). Zebra Mussels are thought to have entered the Great Lakes via ballast water discharged by freighters coming from Europe that entered the Lakes via the St. Lawrence Seaway lock system. The simple expedient of requiring freighters to discharge their ballast water and thoroughly flush out their ballast tanks while in the middle of the ocean would have averted the introduction of these filter feeding mussels. The regulations and procedures for managing ballast water have been upgraded and the number of exotic organisms presumably introduced in ballast water has been greatly reduced. A view of how rapidly these organisms spread throughout the Great Lakes and then most of the freshwater ecosystems in North America is demonstrated by this series of Maps, Map 5A - Map 5D
The rapid spread of the Zebra Mussels shows that exotic species that enter the Great Lakes don’t necessarily stay there. There have been about 7,000 exotic species introductions into the U.S. up to this time. Around 180 of them have been introduced directly into the Great Lakes. A major threat to the Great Lakes now is the possibility of the entry of the Asian Carp, already well established in various river systems in the Eastern U.S. The Chicago River is the main focus of attempts to keep that fish out of the Great Lakes, with a serious high voltage electric barrier on that river near Lake Michigan. But the Chicago River (that was engineered to flow away from Lake
Map 5A: 1986, Zebra Mussels First Discovered in Lake Erie
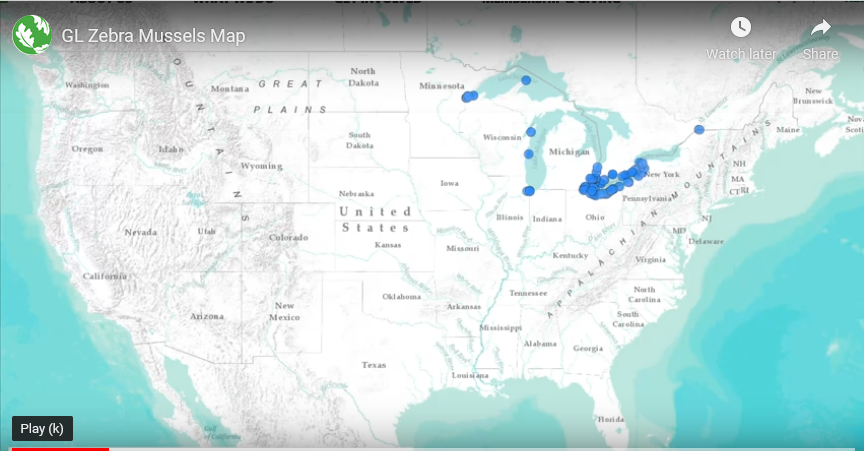
Map 5B: 1989, Early Spread of Zebra Mussels in Great Lakes
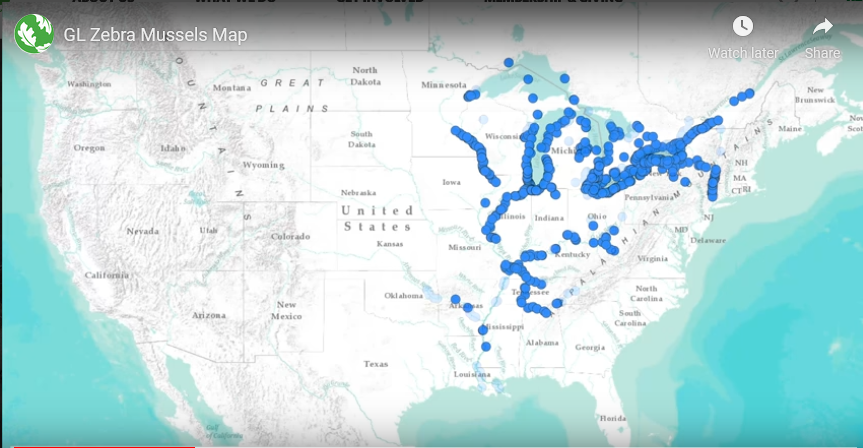
Map 5C: 1993, Zebra Mussels Increase in Great Lakes and Escape from the Lakes
Map 5D: 2017 Distribution of Zebra Mussels
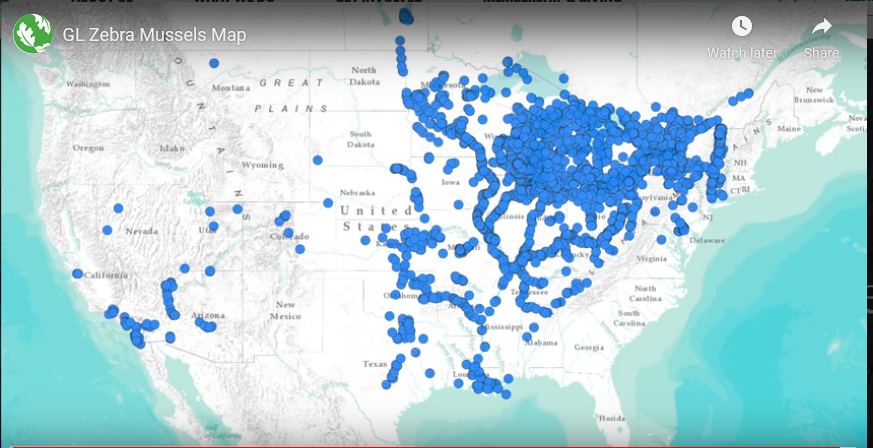
(Maps 5A, 5B, 5C, and 5D source: “Great Lakes Aquatic Invasive Species”, Mapping the Spread of AIS - Zebra Mussels, The Nature Conservancy, at < https://www.nature.org/en-us/about-us/where-we-work/priority-landscapes/great-lakes/great-lakes-aquatic-invasive-species-/ >)
Michigan over 100 years ago) is not the only potential entry point for the Asian Carp into the Great Lakes. There are many other exotic species that have been introduced over the years, and these include plants, microbes, and various types of animals.23
Figure 5 below shows the pace at which a wide variety of exotic species were introduced into the Great Lakes
Figure 5: Introduction of Various Exotic Species into the Great Lakes 1818 - 2018: Bar Chart of 24 Year Intervals
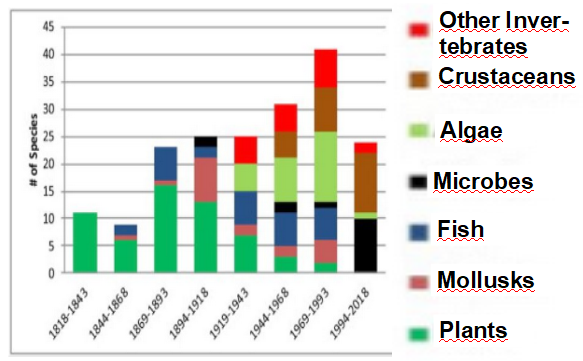
(Figure 5 source: “A recent history of Great Lakes nonindigenous species”, Dec 5, 2019, Rochelle Sturtevant & El Lower, MSU Extension, Michigan Sea Grant, at < https://www.canr.msu.edu/news/a-recent-history-of-great-lakes-nonindigenous-species-msg19-sturtevant19 >)
General Environmental and Ecological Concerns About the North American Great Lakes System
Maude Barlow, was the Chairwoman of the Council of Canadians back in 2011, when she wrote a report entitled Our Great Lakes Commons: A Plan to Protect the Great Lakes Forever. On page 9 of that document she wrote a synopsis of the situation that pertains to the Great Lakes:
“The Great Lakes of North America form the largest group of freshwater lakes in the world, holding more than 20 per cent of the world’s surface freshwater and 95 per cent of North America’s. Add to this the groundwater underlying and feeding the Great Lakes or its tributary streams and lakes, and the percentage is closer to 25 and 97 per cent respectively. The Lakes and the St. Lawrence River, which is their primary flow outlet to the Atlantic Ocean, are bordered by two Canadian provinces: Ontario and Quebec, and eight U.S. states: Minnesota, Wisconsin, Michigan, Illinois, Indiana, Ohio, Pennsylvania and New York. The Great Lakes have a unique biodiversity and are home to more than 3,500 species of plants and animals. They were formed over 20,000 years ago when the last glacier continental ice sheet retreated. The Great Lakes provide life and livelihood to more than 40 million people and are the economic centre at the heart of the continent. They are, however, under serious threat from a wide variety of demands and sources.”
She added on page 13 that:
“The pressure to supply the U.S. with Alberta’s heavy oil is cause for another concern. Bitumen from northern Alberta’s tar sands is increasingly being shipped by pipeline to refineries around the Great Lakes for processing. There is an ever-expanding network of pipelines leading from Fort McMurray to refineries at the tips of Lakes Superior, Michigan and Erie, reports The Toronto Star.(14) The refinement of tar sands oil has devastating impacts on water sources and local communities. Bitumen, the form of petroleum found in the tar sands, is the thickest and dirtiest form of petroleum to process and requires digging, heating and water use on extreme scales. Processing bitumen uses four times more water than conventional oil and releases nitrogen oxides and sulphur dioxides into the atmosphere, creating acid rain. As a result of this booming business of bitumen export from deep in the U.S. heartland, new and increased amounts of acid rain are falling on the Great Lakes.
“There are currently 17 major refinery projects either being planned or developed around the Lakes.(15) The biggest is the BP refinery in Whiting on the south-eastern shore of Lake Michigan in Indiana, which is in the midst of a controversial expansion project aimed at boosting its capacity to process bitumen from the Canadian tar sands. Already, the plant’s unpermitted modifications have resulted in a significant increase in nitrogen oxides, sulphur dioxide, carbon monoxide and particulate matter. An expansion of the Murphy Oil plant in Superior, Wisconsin could damage 300 to 500 acres of wetlands and consume 5 million gallons (almost 20 million litres) of water from Lake Michigan { (sic), that should read Lake Superior} every day”.24
The Great Lakes have suffered from a long history of pollutants and toxic substances being discharged into them, particularly the lower lakes including southern Lake Michigan, and Lakes Erie and Ontario. In the 1970s there was the Polychlorinated BiPhenyl (PCB) disaster. Somehow PCBs ended up in animal feed and in the Great Lakes, though by this time most of the PCBs are in the bottom sediments of the lakes. There was a long history of industries dumping their waste materials directly into the lakes or into streams and rivers that empty into the lakes. This took place in all the lakes but was primarily a major issue in the heavily urbanized and industrialized southern parts of the lake system. A particular problem is biomagnification that concentrates toxic substances as they move through the food web. This results in predator species containing dangerous levels of some toxins, and the fish that people prize from the Great Lakes are, in fact, predator species. Mercury increased in fish species to the point that the number of acres that had advisories against eating fish caught in the Great Lakes increased from 3 million in 1993 to nearly 13 million in 2003. The nature of the problems faced by the Lakes have changed over the years. With the combination of increased regulations that greatly increased the amount and quality of the treatment of waste waters before they were discharged into the lakes, and the near collapse of American industrial production, point source pollution of the Great Lakes was reduced. But now the major source of pollution for much of the Lake Watershed areas is non-point source pollution. That is contained in the runoff from agricultural, and urban and suburban areas. Also confined feeding operations for Pork and Chicken production have successfully lobbied to be exempted from water quality regulations and are able to just allow their wastes to flow, untreated, into the streams that discharge into the Great Lakes. This is most notable in the Western region of Lake Erie, which is now heavily polluted by animal waste and has dangerous algal blooms every summer. In the Western basin of Lake Erie contact with the water can be dangerous and even deadly.25
Map 6: Cumulative Environmental Impacts on the Great Lakes
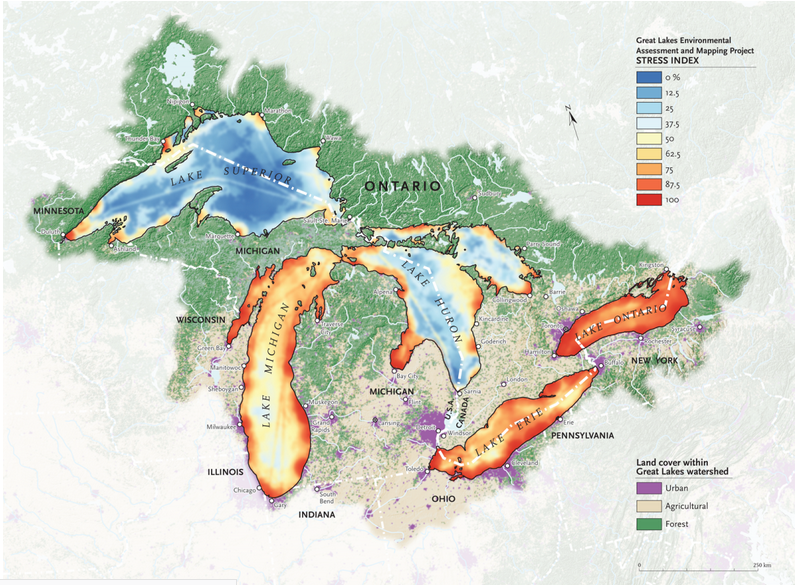
(Map 6 source: “Mapping the human impact on the Great Lakes”, Mar 22, 2017, Nick Walker, Canadian Geographic, at < https://www.canadiangeographic.ca/article/mapping-human-impact-great-lakes >)
The Great Lakes already suffer from a plethora of environmental stresses. The Great Lakes Environmental Assessment and Mapping Project (GLEAM) has identified 34 specific stressors that they have prepared maps to display geographically. Map 6 above shows cumulative effects of all 34 Stressors over the entire Great Lakes system. The 34 Stressors have been grouped into seven categories, listed here below:
Aquatic habitat alterations: Changes to aquatic habitat from diverse causes, such as shoreline hardening and erosion control structures, port and marina development, and tributary dams
Climate change: Changes to seasonal, average, and extreme temperature, precipitation, and ice cover
Coastal development: Land-based human development near lake margins, such as residential and commercial development and industrial activities
Fisheries management: Changes to Great Lakes ecosystems resulting from fishing pressure, stocking activities, and aquaculture
Invasive species: Changes to Great Lakes ecosystems from invasive and nuisance species in abundances not previously seen
Nonpoint source pollution: Nutrients, sediments, and waterborne contaminants transported from watersheds to the Great Lakes by streams and rivers and atmospheric deposition
Toxic chemical pollution: Chemical pollutants from industrial and agricultural sources.26
Part 4: The Petroleum Industry and the Great Lakes
The Great Lake and St. Lawrence River Watersheds are under severe threat from human activities. These activities include though they are not restricted to, oil drilling, and oil transportation by poorly designed, incompetently operated, and unconscionably sited pipelines. Some of the major threats by possible oil spills menacing the Great Lakes, are shown in Map 7 below.
Pipelines, the Athabascan Tar Sands, and the Great Lakes
First we must address the general operation that is taking place in Alberta, Canada.This is the gigantic Athabascan Tar Sands mining operation that has been in operation for many years now (See Map 12). The Athabascan Tar Sands are the most carbon intensive and polluting source of petroleum on the Earth. They are mined and then superheated to melt the “oil” (that is actually the consistency of asphalt) and force it out of the sand. The resultant material is called "Bitumen" and is extremely acidic and therefore corrosive, much more corrosive than any standard crude oil, and is a dangerous petroleum type of material. It is the consistency of peanut butter and still contains a significant amount of sand in it. It has to be heated to a very high temperature, diluted by over 30% with solvents mostly Benzene, and is moved through the pipelines under much higher pressure and temperature than those under which regular crude is transported under. Even purpose built pipelines designed to transport the "Diluted Bitumen" (DilBit) have a high rate of leaks and spills, but when it is transported through old pipelines, not built for the purpose, the dangers of massive leaks and spills is much higher. Imagine what the hot, sandy, high pressure, extremely corrosive material does to the insides of the pipelines and valves as it moves through, particularly in older pipelines not built to withstand this material. Enbridge has published material in which they claim they dilute the Bitumen with solvents making it easier to transport and less corrosive, making it comply with some standard set by the
Map 7: Various Petroleum Operations That Threaten the Great Lakes
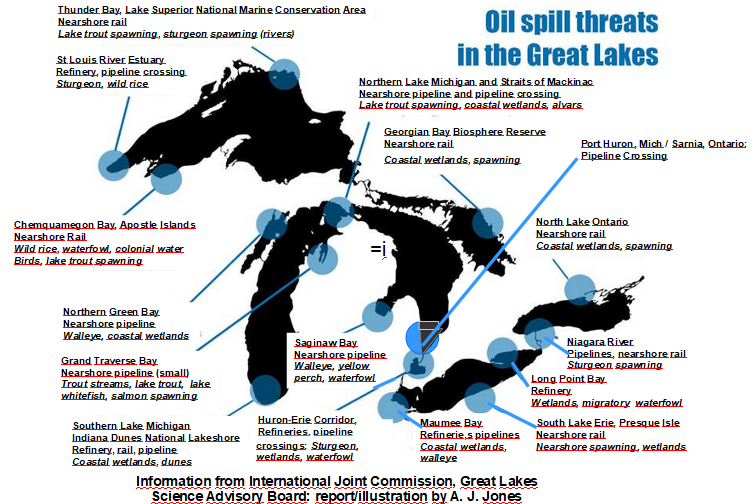
(Map 7 source: “Michigan, Great Lakes at risk for oil spills beyond Line 5, report says”, Dec 17, 2018, Jim Malewitz, Petoskey News, originally in Bridge Magazine, at < https://www.petoskeynews.com/michigan-great-lakes-at-risk-for-oil-spills-beyond-line/article_11500183-4e39-5534-8eb0-e9c325d50c8b.html >: Location of “Port Huron, Mich / Sarnia, Ontario Pipeline Crossing” in Lake Huron Water added by author)
Candian Government for acceptable levels of corrosion. Of course that was already the practice in 2010 when the disastrous Marshall Michigan / Kalamazoo River Spill occurred. The diluted bitumen is generally referred to, by critics of these operations, as Dilbit. I use the terms interchangeably, but any Bitumen being transported in pipelines is in the form of Dilbit. As Maud Barlow pointed out the process of mining and processing the Tar Sands uses 4 times as much water as producing regular heavy crudes does. The mining and processing of the Athabascan Tar Sands has produced a gigantic collection of terribly polluted waste ponds; that now contain nearly 1.639 Trillion liters (432.8 Billion Gallons) of that contaminated water.27 Nobody has any idea of how to clean up that particular debacle, it will just be left sitting there in Northern Alberta to continue to leak and contaminate the environment, the animals, and any people who try to live there. This is the very embodiment of the use by capitalist economic forces of creating a sacrifice zone.
There are two closely interrelated issues concerning the management of our resources, these are the manner in which we use our water and energy resources here in North America. In the recent article posted here at Leftist Politics “OVER 350 GROUPS URGE PRESIDENT BIDEN TO STOP THE LINE 3 PIPELINE” both of the issues of energy policy and the threats to the waters of the Great Lakes were involved.
Map 8: The Enbridge “Lakehead” Pipeline System, that Crosses Michigan and that also Crosses Under the Great Lakes Twice
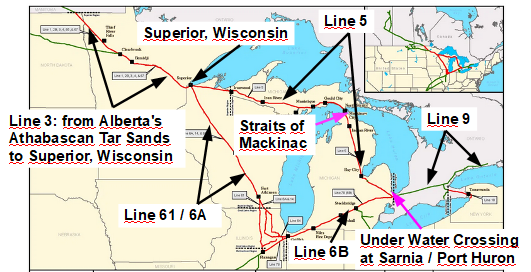
(Map 8 source: “In pushing for Line 5 shutdown, Bad River Band points to alternative route”, Feb 4, 2021, Patrick Shea, Energy News, at < https://energynews.us/2021/02/04/in-pushing-for-line-5-shutdown-bad-river-band-points-to-alternative-route/ >, arrows and labels added by author)
The proposed Line 3 Pipeline project expansion, and the already existing Line 3, carry Athabascan Tar Sands Bitumen, in the form of Dilbit, from Alberta, Canada. As outlined above that product has far worse characteristics than regular crude oil in many ways, Line 3 connects with Line 5 at Superior, Wisconsin. LIne 5 is a creaky and structurally compromised old pipeline (67 years old now) that crosses under the Great Lakes twice. Coming from Superior, Line 5 first crosses under the waters of the Great Lakes at The Straits of Mackinac. The Straits are considered by many experts to be the most dangerous place in the entire Great Lakes for a possible oil spill. Line 3 also connects with Line 61 / 6A at Superior, Wisconsin (there is some confusion in the literature and Line 61 and Line 6A are in fact one and the same, I have generally called it Line 61). Line 61 / 6A connects to Line 6B in Chicago and passes through Illinois and Indiana into Southwest Lower Michigan (Line 6B ruptured near Marshall, Michigan and spilled 1.2 million gallons of Athabascan Bitumen into a tributary of the Kalamazoo River in 2010, that outrage is discussed at much greater length below). At its northeastern terminus Line 78 / 6B joins up with Line 5 and crosses under Lake Huron at Port Huron, Michigan / Sarnia, Ontario, where it connects with Line 9. Enbridge Energy refers to the system of pipelines that carry petroleum products under the Great Lakes at 2 points as “the Lakehead pipelines'' or the “Enbridge Lakehead System”. Map 8 here above shows the “Lakehead'' pipelines and the connections back to the Athabascan Tar Sands mining operation, and onward to Line 9. Line 9 currently moves Athabascan Bitumen to Montreal where it connects to the Portland - Montreal Pipe Line. That pipeline moves the Dilbit to Portland, Maine, an Atlantic Port and Oil Terminal for loading oil tankers, for transport to foreign oil markets.
Line 5: The Biggest Single Danger to the Great Lakes
Line 5 runs from Superior, Wisconsin to Port Huron Michigan / Sarnia Ontario. The line is 645 miles long, with over 500 miles of that length in Michigan. Map 6: that shows the locations of various oil spills from Line 5 since 1968 is here below. Line 5 spilled over 1 million gallons of oil products in Michigan since 1968, the line started operation in 1953, but record keeping for spills did not begin until 1968. Here below, in Figure 2, is a photograph of the most dangerous area, where Line 5 crosses under the Great Lakes at the Straits of Mackinac. The Bridge in the photo is the Mackinac Bridge in Michigan that crosses from the Lower Peninsula to the Upper Peninsula. The Straits of Mackinac are labeled in both Maps 5 and 6. Scientific studies have demonstrated the the flows of water through the Straits of Mackinac are 10 times the amount of water that flows through Niagara Falls and that the water has a tendency to reverse its flow every few days (Technically Lakes Michigan and Huron are actually
Map 9: Line 5 Route Through Michigan and Various Spills Since 1968. Plus Straits of Mackinac and Port Huron / Sarnia Crossings Under the Waters of Lake Michigan and Lake Huron
(Map 9 source: “Line 5”, n.d., anon, Sierra Club, Wisconsin Chapter, at < https://www.sierraclub.org/wisconsin/line-5 >, comments w arrows about Straits of Mackinac and Port Huron / Sarnia pipeline crossings added by author)
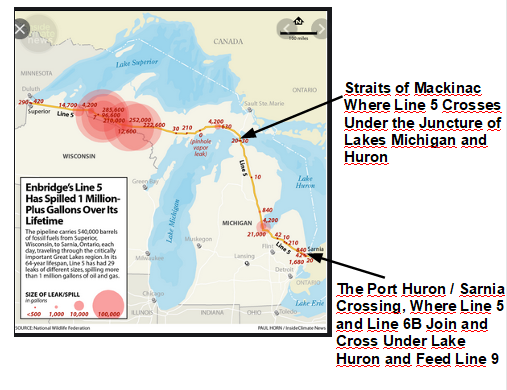
one lake with two large lobes and a narrow connecting channel, the Straits of Mackinac. There is no altitudinal difference between the two lobes of the giant lake). David Schwab, a hydrodynamics expert at the University of Michigan Water Center, has stated that: ““If you were to pick the worst possible place for an oil spill in the Great Lakes, this would be it, … The currents are powerful and change direction frequently. In the event of an oil spill, these factors would lead to a big mess that would be very difficult to contain.”28
Furthermore at this extremely critical and vulnerable place, where the pipeline crosses at the Straits of Mackinac between Lakes Huron and Michigan, the pipeline does not even comply with: "... Enbridge's 1953 easement with the state of Michigan (that) specifies the pipeline must have anchor supports across any gaps in the lakebed span greater than 75 feet, a 2003 survey identified 16 unsupported spans greater than 140 feet, with the longest being 224 feet on the east pipe and 286 feet on the west pipe. … An anchor strike was identified as the principal threat to Line 5 in the Alternatives Analysis report presented to the Pipeline Safety Advisory Board Committee in July 2017. … anchor drags have happened more than once. The risk of rupture increases as the pipeline ages. There is typically about 1 million gallons of product in the pipeline at any one time. The April 2018 anchor strike broke two electrical lines nearby and put 3 dents into Line 5 which further weakened Line 5’s structural integrity. On June 18, 2020 Enbridge disclosed undetected damage to Line 5 in the Straits caused by an unknown source which resulted in the temporary voluntary shutdown of both pipelines. Enbridge discovered this while they were repairing coating on the aging pipeline and were in the area.”29
One citizen’s organization concerned about the fact that Line 5 crosses the Straits of Mackinac published the following list of problems that address; the pipeline itself; the sensitive place where it crosses the Lakes; and the company, Enbridge, that owns and operates the pipeline. That List is posted here:
“A number of troubling factors have come together that cause grave concern:
An anchor strike from a ship in peril in 2018 gashed and dented both underwater pipelines
Figure 6: The Mackinac Bridge and the Route of “Line 5: Under the Water in the Straits of Mackinac.
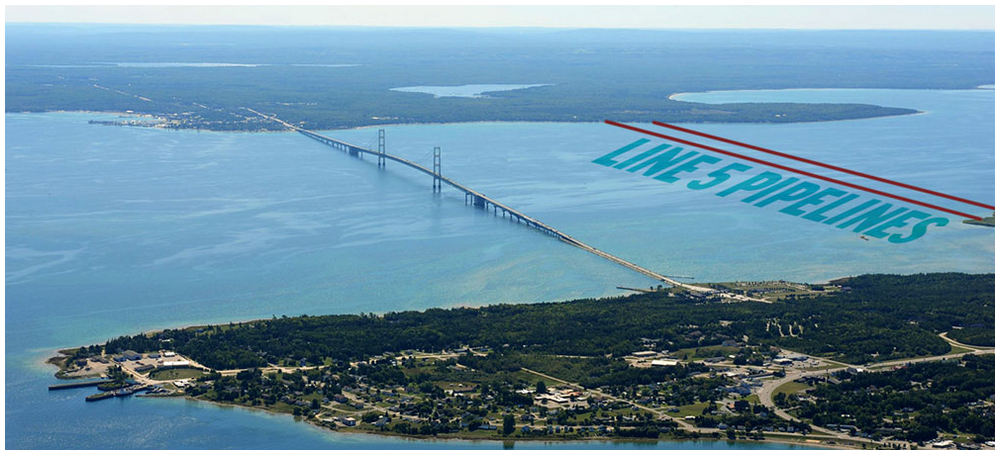
(Figure 6 source: “The Problem”, “Overview”, Oil and Water Don’t Mix, at < https://www.oilandwaterdontmix.org/problem >)
The tarnished safety record of Enbridge, Inc., the Canadian company that operates the pipeline including the largest inland oil spill when its Line 6B spilled 1.1 million gallons of tar sands bitumen into the Kalamazoo River in 2010
There are ongoing issues of compliance with the contract between the pipeline company and the State of Michigan (the easement) including 8 known violations
The age, location, and questionable condition of the pipeline
An increase in the volume and pressure of fluids moving through the pipelines
The lack of transparency about safety inspections and what petroleum products are being transported through Line 5 in the Great Lakes
The lack of a proactive regulatory environment in Michigan and at the federal level
University of Michigan scientists modeled the currents in the Straits of Mackinac and called it "the worst possible place for an oil spill in the Great Lakes."
Line 5 is a shortcut for Canada's benefit with less than 5 to 10% of the product used in Michigan.
Scientists warn that we have less than 10 years to reduce carbon emissions by half or face dire consequences from a dangerously overheating climate. It is even more urgent to move away from dirty fuels like the ones carried by Line 5”30
The State of Michigan Finally Acts
In response to the many concerns and issues about “Line 5”: “On November 13, 2020, Michigan Gov. Gretchen Whitmer took decisive action to shut down Line 5 by May of 2021 under the Public Trust Doctrine to protect the Great Lakes from the risk of a catastrophic oil spill in the Straits of Mackinac. The State of Michigan is revoking and terminating the 1953 easement that Enbridge has relied on to operate its dual Line 5
Figure 7: Proposed Tunnel Project at the Line 5 Crossing Under the Straits of Mackinac
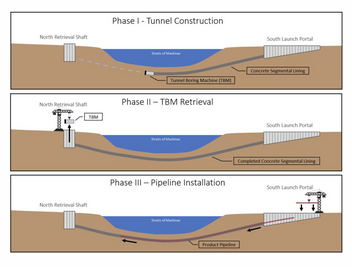
(Figure 7 source: “Line 5 in the Straits of Mackinac”, n.d., anon., “What is the Oil Tunnel?”, For Love of Water (FLOW), at < https://forloveofwater.org/line5/ >)
pipelines in the Straits of Mackinac due to repeated violations of the easement. … The State of Michigan, however, must remain vigilant until the oil stops flowing for good because Line 5 remains exposed to exceptionally strong currents, lakebed scouring, new anchor and cable strikes, and corrosion.”31
The only response by Enbridge Energy, that owns and operates Line 5, has been to propose building a “tunnel” under the Straits of Mackinac (shown diagrammatically in Figure 7), and when it is completed to run the pipeline through it: “Enbridge is proposing to bore and blast a 20-foot-in-diameter oil tunnel under the Straits of Mackinac to house a new Line 5 pipeline. The Canadian company’s goal is to continue for another 99 years carrying up to 23 million gallons of oil and natural gas liquids a day through Line 5 … FLOW and our partners have identified critical deficiencies in the project’s construction permit application … including from the daily discharge of millions of gallons of wastewater during construction.”32
Enbridge Line 6B and the Disastrous 2010 Pipeline Rupture at Marshall, Michigan
The other major branch of the Enbridge Lakehead Pipeline system is Pipeline 6B that runs from Chicago, through Illinois and Indiana, and through Southern Lower Michigan to the Port Huron, Michigan / Sarnia, Ontario area where it joins Line 5 and these pipelines cross in Great Lakes waters yet a second time.
On July 25th, 2010 Pipeline 6B ruptured and spilled over 1.2 million gallons of Diluted Bitumen into Talmadge Creek, a tributary of the Kalamazoo River. A spill that threatened to arrive at Lake Michigan, though in the end it was stopped more than 50 miles short of Lake Michigan. It was the second largest inland oil spill in U.S. History. In fact: "Enbridge is responsible for the top 2 largest inland oil spills in the United States - Line 3 which broke in 1991 near Grand Rapids, Minn., spilling over 1.7 million gallons of oil, and Line 6B that broke and contaminated the Kalamazoo River watershed in 2010 with over a million gallons of oil per the EPA. The Michigan spill spoiled 35 miles of river and shore badly enough that they were closed for 2 years. It sickened numerous people, harmed wildlife, and resulted in more than 100 families moving permanently." The actual material in transit in Line 6B: “On the day of the spill, 6B was moving a mixture of two types of dilbit—about one-quarter Western Canadian Select and three-quarters Cold Lake.”33
Map 10: The Clean-up Segments of Talmadge Creek, and the Kalamazoo River After the Enbridge Dilbit Spill: From Marshall, Michigan to Just East of Kalamazoo, Michigan
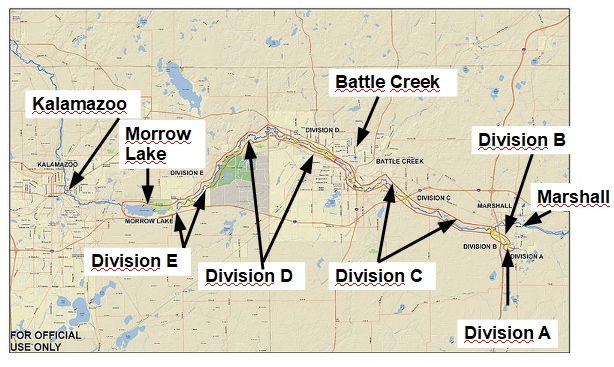
(Map 10 source: “Kalamazoo River oil spill”, Photo Gallery, Wikipedia, at < https://en.wikipedia.org/wiki/Kalamazoo_River_oil_spill >, arrows and labels added by author)
What is more, Enbridge kept pumping the Bitumen through line 6B for about 2 of the over 18 hours that passed, after when they first noted a fall in the line pressure to zero in the spill area, and when the rupture and spill was finally reported to them. A pressure drop to zero is a sure sign of a potential break in the pipe, but can also be an indication of a bubble in the pipeline.. The pipeline operators, working in a control room in Edmonton, Alberta Canada, reasoned that a bubble had developed and that that was the reason for the fall in pressure. The crew that was on duty when the pressure drop was first noted did not even bother to inform the crew that replaced them of the pressure drop. These two crews twice restarted operations for about an hour each time, and that kept pushing the Dilbit through the rupture area into Talmadge Creek. Did they call and wake up any Enbridge employee and tell them to go take a look (of course where was the closest Enbridge employee to Marshall, Michigan), NOOOOOO!!, did they notify the local authorities of a possible problem and just where it might be, NOOOOOO!!.
In fact it was local people who noticed the leaking Bitumen called and alerted Enbridge to the fact that their shoddy and, at the time, 41 year old pipeline was leaking. Furthermore, later Enbridge lied to local authorities and did not inform them that this was Dilbit, and not a standard crude. It took the cleanup people a couple of weeks to figure it out; and to come to the realization that this debacle was even worse than a standard crude oil spill. The EPA and state and local officials belatedly realized that they could not rely on standard oil spill techniques, but had to take very different appropriate measures. Enbridge was not obligated, under the Federal Regulations in force at that time, to notify the EPA, local authorities grappling with the spill, or anybody else that the spill was not regular crude oil, but instead was Dilbit; and they did not do so. The company claimed it did not figure out that there was a leak until almost noon on July 25th, but one family who lived near Talmadge Creek pointed out that a man driving an Enbridge Company truck and carrying portable air sampling equipment arrived at their house, before 10:00 AM, and told them “It’s not safe to be here. You’re going to have to leave your house. Now.”34 So it appears that Enbridge’s narrative about the spill is a lie from beginning to end.
The CEO of Enbridge flew to Michigan, in the company’s private jet on the day after the spill occurred, on July 26th 2010, and after arriving:
“Enbridge’s president and chief executive officer, Patrick Daniel, perpetuated the mistaken belief that this would be a routine cleanup. On Monday, Daniel had flown in from Enbridge’s Calgary, Alberta, headquarters in the company jet. In an interview the next day, he said much of the oil could be sucked off the water’s surface with vacuum trucks and that only a ‘minuscule’ amount might sink below the surface.
“ ‘To tell you the truth, it’s lighter than water so it sits on top of the water,’ he said.”35 .
The Dilbit spill separated into the heavy component, the Bitumen that sank to the bottom of Talmadge Creek and the Kalamazoo River and coated it with material that resembled chewing gum, and the volatile components of the diluent that evaporated into the air. The major volatile component was Benzene, an extremely toxic material, but there were also a large number of other volatile components, many of them also very toxic. People living near the spill were overwhelmed by the horrible stench and suffered numerous symptoms such as headaches and nausea. The majority of those living close to the spill area moved out and stayed in hotels or with friends or relatives in the days immediately following the disaster.36
Fortunately this spill did not reach Lake Michigan. After the spill Enbridge conducted a major cleanup operation under the direction of the EPA. The Kalamazoo River already had some areas with serious contamination problems, but the stretch of the river where the Enbridge Bitumen Spill occurred was relatively pristine. It was a stretch of the river with a wide variety of wildlife, and a natural stream bed largely unaltered by human actions. The clean-up process included scraping up the Dilbit and some of the sediment on the bottom of Talmadge Creek and in the Kalamazoo River and removing them. Some dredging was also undertaken in the worst affected areas. The Stream course was greatly modified by this removal of bottom sediments. The final decision was to not conduct widespread dredging and rather to collect the heavy oil at the 3 places where it accumulated in the Kalamazoo River (those 3 are Morrow Lake just east of Kalamazoo, the Mill Pond in Battle Creek, and Ceresco Dam east of Marshall, See Map 7). The Bitumen coated the bottom of the creek and the river and moved downstream along the creek and river bottom, and eventually most of it came to rest at one of those 3 places. The cleanup operation came to the conclusion that it could not recover all the Bitumen, and something like 5% - 10% of it remains in the sediments of the river bottom. The Kalamazoo River certainly did not recover to anything like its original near-pristine condition and now has much lower levels of biological diversity, wildlife, and fish in its waters and along its shoreline.
Enbridge's criminally negligent and dishonest actions nearly allowed the Dilbit to reach Lake Michigan. The company ignored many warnings of weak spots and problems along the 41 year old pipeline’s length:
“In 2008, Enbridge identified 140 corrosion defects on 6B as serious enough to fall into the 180-day category. But the company repaired just 26 of them during that period.
“In 2009, Enbridge self-reported a separate set of 250 defects to PHMSA. The company fixed only 35 of them within 180 days. (PHMSA is the Pipeline and Hazardous Materials Safety Administration)
“Instead of immediately addressing the 329 defects that now remained, Enbridge got a one-year extension from PHMSA by exercising its legal option to reduce pumping pressure on 6B while it decided whether to repair or replace the line.”37
Defects at the actual place, mile post 608, where the line ruptured were noted previously at least 3 times: “... in 2005, 2007 and 2009, according to documents Enbridge filed with PHMSA over the years. But each time, Enbridge decided it wasn’t significant enough to require repairs within 180 days. Ten days before 6B ruptured, Enbridge applied to PHMSA for another extension. It asked for an additional two and a half years to decide whether 6B should be repaired or replaced.”38
Ten days before the Marshall, Michigan spill, a high ranking company official: “Richard Adams, the company’s vice president of U.S. operations, assured a congressional subcommittee on pipeline safety that Enbridge was well prepared for an emergency. ‘Our response time from our control center can be almost instantaneous, and our large leaks are typically detected by our control center personnel,’ ”39 (emphasis added). In the Enbridge Emergency Response Plan: Superior Region the company claimed that “The Material Balance Leak Detection will recognize a rupture within 5 minutes of a rupture occurring … The Material Balance Leak Detection is a backup to operator recognition … All motor operated valves in the Enbridge liquid mainline system close in 3 minutes or less” (emphasis added), thus in this document Enbridge was stating it would routinely close down a ruptured pipeline in less than 10 minutes. In neither the Line 62 / 6A spill in the Grand Rapids, Minnesota in 1991, nor in the 2011 Marshall, Michigan DilBit spill did that optimistic time frame or that supposed alacrity describe the Enbridge response.40
Enbridge has, overall, an appalling safety and spill record. The two large spills at Grand Rapids and Marshall were by far the largest spills, but certainly not the only ones. “Using data from Enbridge’s own reports, the Polaris Institute calculated that 804 spills occurred on Enbridge pipelines between 1999 and 2010. These spills released approximately 161,475 barrels (25,672.5 m3) of crude oil into the environment”. The same source reports 14 spills from Enbridge operated pipelines before 1999.41 Enbridge is involved in operating about 15,000 miles of fully company owned pipelines and around 100,000 miles of pipelines operated with partners in various arrangements. Map 8 below illustrates the fact that, for the 307 spills by Enbridge and some other pipeline operators included in the report, these spills are constant and take place all over the entire Enbridge Pipeline System.42
In Map 11 below the size of the various spills is reflected by the size of the various red and blue circles.
Map 11: Enbridge Pipeline Spills in United States: 2002 - 2018. With Grand Rapids, Minnesota 1991 Spill of 1.7 Million Gallons Added
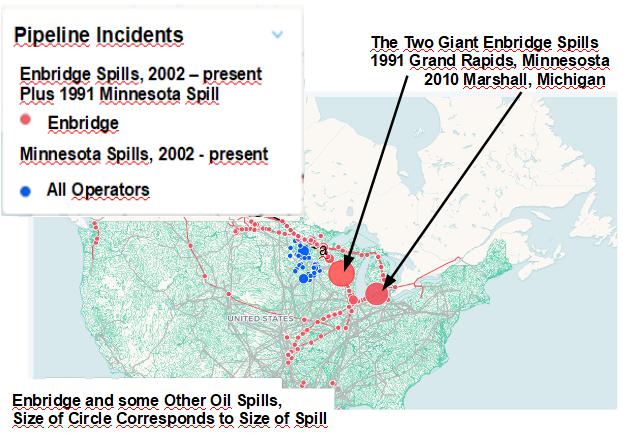
(Map 11 source: “Dangerous Pipelines: Enbridge's History of Spills Threatens Minnesota Waters”, Nov 14, 2018, anon., Map in “PHMSA Data on Enbridge Pipeline Spills”, Greenpeace, at < https://www.greenpeace.org/usa/reports/dangerous-pipelines/#enbridge-history >)
Enbridge is clearly not trustworthy, and the time has come to quit subsidizing every crazy scheme the Fossil Fuel Tycoons come up with. The Athabascan Tar Sands Mining Operation should come to an end ASAP. We need to start investing heavily in various types of Green Energy. Burning fossil fuels must stop, oil, coal, and natural gas reserves will have a long future as feed stocks for the production of various materials, but the days of combustion for power should end ASAP.
Consequences of the Line 6B Rupture and Spill
Wildlife always suffers terrible consequences from the many oil spills from the pipeline systems of North America. But human health and well being is also terribly affected by these ongoing spills. One report, from an author very skeptical of the official story and the bland reportage of consequences in the Corporate Controlled Media, about the Enbridge Marshall, Michigan spill in testimony from an area resident noted that:
“Two months in, this woman, Shannyn Snyder, she was an anthropologist and she had been down in the Gulf of Mexico studying the BP oil spill, and other spills too. Well she came up to Michigan and she told us what to look for, and what would happen. Who would die first. And things happened just as she said. First the alcoholics would pass. Then the elderly folks. Then those who have immune difficulties. Then people will start getting weird diseases. And to this day, when I look back at my notes, everything happened just like she said it would. ... (Local residents reported various anecdotal occurrences) “Respiratory difficulties. ** A cyst under my left eye. ** One inhaler used to last me a month and now I go through one every week. ** My cancer has gotten worse. ** I have been diagnosed with cancer. ** My husband lost his foot, and then his leg to an unknown infection. Then he passed. ** My dog died. ** I have been diagnosed with cancer. ** The two women in that trailer who used to be alcoholics but had been sober for years – they died shortly after the spill. It was the worst thing to see, watching them deteriorate. Their skin turned all yellow in the last few days. ** I never used to have this many seizures. ** I know two young boys who had a father at the time of the spill and no longer do. ** My teeth got infected and they had to pull them all out. ** My dog died. ** I had a seizure for the first time. ** Skin lesions. ** My neighbor is on dialysis like four times a week. ** I have this rash that never went away, and sometimes it swells up and gets infected. ** Any underlying condition you might have had, the oil spill just accelerates it. ** I can’t be around chemicals anymore without getting sick. Not even the cleaning product (a)isle in the grocery store. I can’t stand the smell. ** My son has neurological problems. ** I’ve always had allergies but now they last all year round. ** All her pet birds dropped off, one by one. ** Headaches.”43
Map 12: Submerged Dilbit Oil Problems That Remain After the 3 Year Clean-up Project on the Kalamazoo River, Michigan.
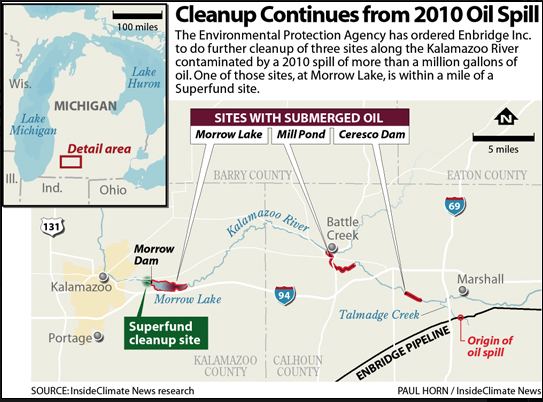
(Map 12 source: “Tar Sands Dilbit Disaster continues on Kalamazoo River”,
Creating a Sustainable Future: Sustainable ideas for practical people, at < http://sustainabletransition.blogspot.com/2013/08/tar-sands-dilbit-disaster-continues-on.html >, the source where I found the map noted that the original source for the map was an article by Paul Horn at Inside Climate News, but I could not find it there)
Some Photographs of the Disaster
Figure 8 below is a photo of the ruptured segment, about 6 1/2 feet long, that spilled oil into Talmadge Creek, a tributary of the Kalamazoo River near Marshall, Michigan. Note that the pipeline clearly appears to be a “rolled” piece of steel that has a seam in it where it is rolled together and welded. That method of producing a pipe, while being cheaper and easier, always results in a vulnerable weak line that more easily ruptures than a one piece pipe would.
Figure 8: The Ruptured Segment of the Enbridge Line 6B Pipeline, that Spilled 1.2 Million Gallons of Athabascan Bitumen at Marshall, Michigan in 2010.
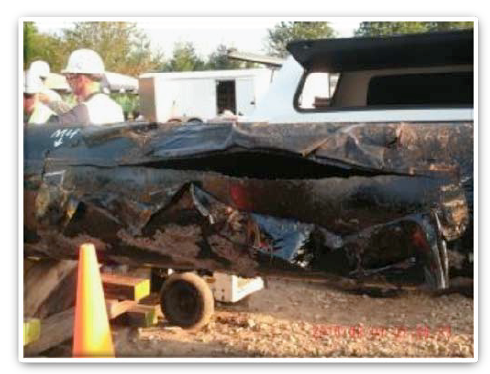
(Figure 8 source: FOSC Desk Report for the Enbridge Line 6b Oil Spill Marshall, Michigan, “Figure 2 – Ruptured Portion of Line 6B Pipeline”, USEPA)
When discussing the Diluted Bitumen it is not really clear just what it is we are discussing. Here In Figure 9 below, a person is holding a handful of Athabascan Tar Sand, as it appears when it is first mined. This is a very low quality petroleum source with a poor “net energy gain”. As Inside Climate News published: “The average “energy returned on investment,” or EROI, for conventional oil is roughly 25:1. In other words, 25 units of oil-based energy are obtained for every one unit of other energy that is invested to extract it.
“But tar sands oil is in a category all its own.
“Tar sands retrieved by surface mining has an EROI (Energy Return on Investment, dm) of only about 5:1, according to research released Tuesday. Tar sands retrieved from deeper beneath the earth, through steam injection, fares even worse, with a maximum average ratio of just 2.9 to 1. That means one unit of natural gas is needed to create less than three units of oil-based energy.”44
Figure 9: A Handful of Athabascan Oil Sand
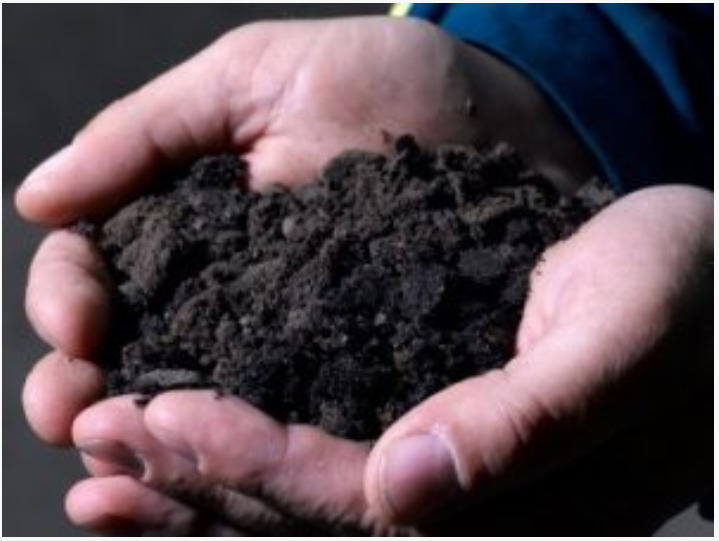
(Figure 9 source: “Keystone XL Primer: Secrecy Still Shrouds Diluted Bitumen Risks”, Nov 2, 2011 Marie C. Baca, InsideClimate News, at < https://insideclimatenews.org/news/02112011/keystone-xl-oil-sands-pipeline-diluted-bitumen-dilbit-secret-chemicals-corrosion-spill-enbridge/ >)
In a 2016 article the authors point out the serious environmental consequences of widespread Oil Sands exploitation writing that: “We estimated that their exploitation, given projected production trends, could result in 1.31 km3 /yr of freshwater demand and 8700 km2 of forest loss. The expected escalation in oil sands extraction thus portends extensive environmental impacts.”45 For comparisons: the annual flow of the Mississippi River ranges from 0.00219 km3 /yr to .0073 km3 /yr: the volume of Lake Ontario, the 4th largest of the Great Lakes is 1,640 km3. These issues are more comprehensively addressed by Jordaan.46
The potential future impact of Tar Sands mining in Alberta is reflected in the fact that: “As of 2009, only 600 km2 of land were disturbed by surface mining, accounting for 0.3% of the area where oil sands resources are present, or less than 0.1% of the total land area of Alberta. Eighty percent of the resource is currently expected to be extracted using in situ technologies, affecting approximately 136 000 km2 (97% of the total oil sands area). While natural gas is used in surface mining, in situ recovery can use on the order of four times more than surface mining. The cumulative footprint of the future oil sands operations may extend over approximately the 140 000 km2 during the course of the development, comprising of 20% of Alberta, and even more if the upstream footprint from the infrastructure required for natural gas production is included.”47 In-situ, as it is used in this article, refers to deep mining of the Tar Sands. That method of mining becomes necessary after a depth is reached below which surface mining is no longer feasible. By necessity deep mining is more energy and resource intensive than is surface mining. The article notes that deep mining uses 4 times as much natural gas as surface mining.
Another issue is what happens to the horribly polluted water produced by the processing of the Athabascan Tar Sands that takes place in Alberta, that produces the Bitumen. This extremely toxic water is dumped into “holding ponds'' that by this point in time amounts to: “... three million gallons' worth every day—in vast, open pools. But these tailing ponds, as they're called, are leaking into rivers like the Athabasca, harming wildlife and increasing cancer rates in humans. If Alberta can't handle the toxic sludge it already has, how will it deal with more?”48 I performed some rough calculations and obtained a figure of something like 0.125 km3 of extremely polluted process water has been produced and is already lying about in “tailing ponds, and end pit lakes”, or is leaking back into the Athabascan River. Afterwards I found a website with a figure of 1.395 Trillion Liters of contaminated water;49 that equals 0.139 km3 of the extremely polluted process water. That amounts to an amount of contaminated water that ranges from 63.7 times the annual flow (low flow year) to 19.1 times the annual flow (very high flow year) of the Mississippi River.
Bland statements about the numbers of birds and other creatures that are covered by toxic crude oil does not reflect the true horror of what happens to animals and plants that live in a spill area. Even with the most careful and advanced cleaning methods
Figure 10: Oiled Canada Goose, Resulting from Enbridge Line 6B Bitumen Spill at Marshall, Michigan in 2010
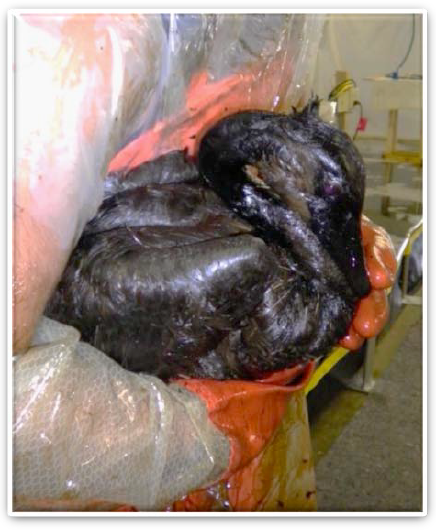
(Figure 10 source: FOSC Desk Report for the Enbridge Line 6b Oil Spill Marshall, Michigan, “Figure 3 – Oiled Canada Goose {Photograph Courtesy of USFWS}”, USEPA)
only a minority of animals that are “oiled” survive the experience. And Enbridge, after a few days of the cleanup operation, forbade the volunteers from cleaning any more oiled wildlife citing liability issues. Figure 10 above is a photo of one such victim of the Enbridge Marshall, Michigan Line 6B spill.
Enbridge Pipeline 6B System After the Marshall Oil Spill.
Map 13: Enbridge Replacement and Expansion Projects
for Line 6B in Southern Michigan
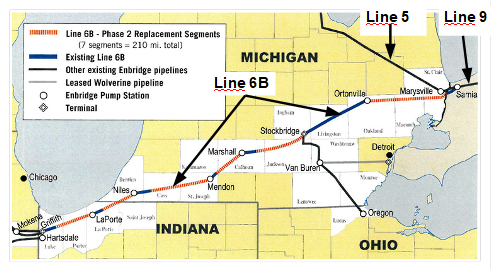
(Map 13 source: "Enbridge Gas Pipeline Map {Page 1}", Map: "Will Enbridge Energy's new pipeline in Michigan be safer?", at < https://line.17qq.com/articles/dlplpplcv.html >, arrows and labels added by author)
Map 13 shows the route of Line 6B through southern Lower Michigan and it demonstrates the plans and actions by Enbridge Energy to keep using Line 6B to transport various types of petroleum products. Athabascan Tar Sands Diluted Bitumen, Dilbit. is the major component of those materials that are moved through Michigan and under Lake Huron at Port Huron, Michigan / Sarnia, Ontario. The upper right hand corner of Map 8 shows Line 5 arriving at Marysville, Michigan and joining with Line 6B in sending its material across under Great Lakes waters; for a second time in the case of Line 5. Most of Line 6B was rebuilt in the 3 years following the Marshall Michigan, Kalamazoo River spill in 2010. This was done to increase its capacity and to upgrade the 41+ year old pipeline to a standard designed and built to move Dilbit. Enbridge applied for permission to reopen the pipeline just 2 weeks after the spill but were at first denied. But 2 months after the spill the various regulatory agencies permitted Enbridge to resume operations.
Pipelines Pipelines, so many Pipelines!!
Map 14: A Close-Up Look at Line 3
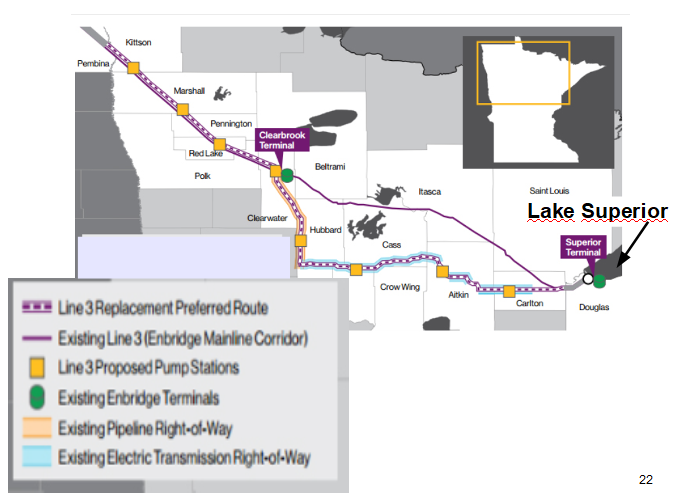
(Map 14 source: "What’s next for the Enbridge Line 3 project in Minnesota? Construction. And protests.", Dec 3, 2020, MinnPost, Great Lakes Now, at < https://www.greatlakesnow.org/2020/12/enbridge-line-3-project-minnesota-construction-protests/ >, modified by author.)
Map 14 shows the "Line 3 Replacement Preferred Route" in purple and white. That follows the original Line 3 route running from NW Minnesota through Kittson and Pembina counties down to the Enbridge Clearbrook Terminal. Then the "Replacement Preferred Route" goes south and later turns east following an "Existing Electric Transmission Right-of-Way", highlighted in blue, towards the Enbridge Superior Terminal. First let's clear something up, Superior, Wisconsin and Duluth, Minnesota are "twin cities" that form a metro area with a population of about 278,000. They are located on the far western corner of Lake Superior, and their harbor already includes one of the two largest single areas of water contamination in the beautiful and still near-pristine, Lake Superior. And what does Enbridge Energy propose to do with the "Existing Line 3 (Enbridge Mainline Corridor)" shown as a simple purple line on Map 9. Well in fact not very much, they propose to clean the pipe and leave it buried in the ground. The rationale for this is that removing old pipes causes more problems than leaving them in place. That is no doubt true, but the old pipeline needs some ongoing monitoring to make sure that no more contamination occurs. At the very least Enbridge must be forced to monitor the old pipe on a regular basis and not leave it to the local governments and Indian Tribal Councils to handle that specialized operation; and to pay for any needed cleanup, expenses that could easily run into large amounts of money.
Local people living in areas where Enbridge has operated for years have a different point of view on just leaving the previous Line 3 in the ground. The Grand Rapids , Minnesota Herald Review has written that: “Enbridge doesn’t care about us. Instead of cleaning up this mess, and putting hard-working Minnesotan union members to work doing it, Enbridge simply plans to abandon the pipeline and inevitable contamination in the ground, walk away, and build an entirely new Line 3 pipeline in a brand new corridor. The State of Minnesota, including the Public Utilities Commission (PUC), has the power and responsibility to regulate pipeline abandonment, but there is currently no plan. Because Line 3 is the first crude oil pipeline to be abandoned in our state, there is a risk that the PUC will avoid their responsibility and set a disastrous precedent. But tribal governments, landowners, local businesses, and concerned community members across the north are standing up to say no, and demand accountability.”50
Map 15: Line 3 and the Various Local Connections to Other Pipelines, Refineries, and Terminals
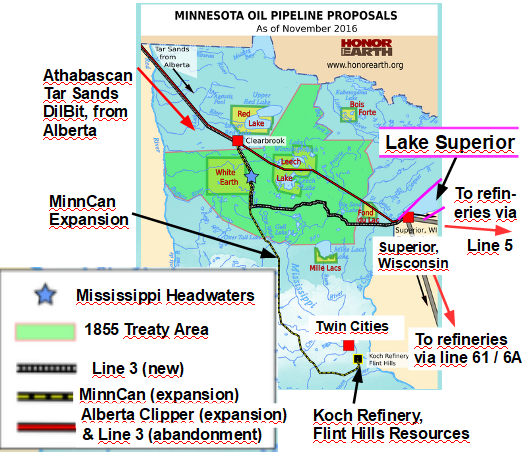
(Map 15 source: "Line 3", n.d., anon., Honor the Earth, at < https://www.honorearth.org/sandpiper_line_3_corridor >, modified by author)
Map 15 shows that in the Duluth / Superior area Line 3 connects with Lines 5, 6A, 61, and 66 (proposed). The Governor of Michigan, Gretchen Whitmer ordered that Line 5 be shut down in November of 2020, giving Enbridge Energy until May of 2021 to close Line 5 in an orderly manner. Enbridge Energy declared they would not obey the Governor's order and immediately filed lawsuits against the State of Michigan. They also enlisted the Government of Canada to try to avoid shutting down Line 5. "Line 5 has spilled 33 times and at least 1.1 million gallons along its length since 1968."51
Map 15 also shows something called the "MinnCan (expansion)", a proposed pipeline, that would carry Athabascan Bitumen down to the Minneapolis / St. Paul area to the Flint Hills Resources "Pine Bend Refinery", actually located in Rosemount, Minnesota 17 miles SE of Minneapolis. Flint Hills Resources is a wholly owned subsidiary of Koch Industries.
Part 5: Other Pipeline Projects Being Built, or Proposed, to Move Athabascan Tar Sands Bitumen
Pipelines to the West, To Reach Pacific Oil Terminals
The fossil fuel interests want to build as many pipelines as possible to move Athabascan Bitumen out of Alberta. The Line 3 / Line 5 Lakehead pipeline system, is only one of three major routes to transport the Bitumen out to refineries and markets. The Canadians are already busy building one pipeline, and have proposed another both of which must cross the mountains to the west. They both have the purpose of moving the Athabascan Bitumen out to Pacific Oil Terminals. The pipeline already under construction is the TransMountain Pipeline and the proposed one is the Enbridge Gateway Pipeline (See Maps 17 & 18 below).52
Pipelines to the South, To Reach Gulf Coast Refineries and Oil Terminals
The Koch Brothers, before the death of David Koch, now just Charles Koch, wanted to get a pipeline built from the Athabascan Tar Sands region to the Houston, Texas area. Koch Industries owns a gigantic refinery, named the Flint Hills Refinery, near there. It is actually in Corpus Christi, Texas, and was purpose built to handle Orinoco Tar Sands material from Venezuela. Of course the Kochs were, and Charles Koch certainly still is, virulent far-right wing ideologues. They wanted to quit buying the Orinoco Bitumen from the leftist government in Venezuela and bring in Athabascan Bitumen if at all possible. As far as I can tell Koch Industries has not achieved that goal and still purchases Orinoco Tar Sands Bitumen or some other "heavy oil". The refineries along the Texas Gulf Coast are all set up to refine heavy crude and cannot handle the lighter crude oils produced in much of Texas and the Gulf Coast area, without expensive modifications. The Koch Industries Flint Hills refinery needs very heavy oil or Bitumen, and the Venezuelans and the Kochs are still stuck with each other.53 The desired pipeline to rectify this situation for Koch Industries and other refineries designed to handle heavy oil is the: "... Keystone XL. It runs from Hardisty, Alberta, to Steele City, Kansas" and is not yet completed. It is the last phase of a 4 part Keystone Pipeline project. The recent history and current status of the Keystone XL pipeline are:
"On March 24, 2017, Donald Trump signed a presidential permit to allow TransCanada to build the Keystone XL pipeline.
"In April of 2020, a federal judge in Montana revoked a key permit that had been issued by the Army Corp of Engineers in response to a legal challenge brought by a coalition of environmental groups. The outcome requires that the army corps suspend all filling and dredging activities until it conducts formal consultations compliant with the Endangered Species Act. The ruling revokes the water-crossing permit needed to complete construction of the pipeline, and is expected to cause major delays.
"Construction began in April of 2020 in Montana after TC Energy Corp secured $1.1bn in financing from the Canadian provincial government of Alberta to cover construction through 2020 – and agreements for the transport of 575,000 barrels of oil daily.
"In July 2020, the U.S. Supreme Court rejected a request from the U.S.'s Trump administration which would have allowed the construction of parts of the Keystone XL Oil Pipeline that had been blocked by a federal judge in Montana in April 2020.
"Despite legal setbacks, in June 2020 the U.S. Energy Information Administration (EIA) continued to report that the project is proceeding.
"In January 2021, TC Energy suspended work on the project as U.S. President Joe Biden revoked the project's vital presidential permit via executive order on his first day in office. TC Energy said that it "will review the decision, assess its implications, and consider its options." The company did not immediately raise the option of legal action."54 {Emphasis added}.
The Larger North American Pipeline System and the Centrality of the Athabascan Tar Sands of Alberta, Canada
The Athabascan Tar Sands of Alberta is one of the largest petroleum deposits on the Earth. However, they are extremely difficult to extract, and are only marginally worth extracting on a net energy gain and resource quality basis. The tar sands require large amounts of energy to heat them and force the oil out and, as Maude Barlow pointed out, use 4 times as much water to process as regular crude oil uses.
Map 16, The Athabascan Tar Sands of Alberta Canada
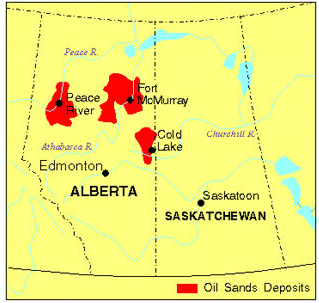
(Map 16 source: “Oil Sands”, Mar 20, 2014, Conny Davidsen, The Canadian Encyclopedia, at < https://www.thecanadianencyclopedia.ca/en/article/oil-sands >)
The United States and Canada already have a very extensive system of pipelines to transport crude oil, natural gas, bitumen, and various refined petroleum products. According to the Pipeline and Gas Journal: “In North America, there are currently 1,243 active and suspended pipelines operating …”. As far as I can determine the map of pipelines below, Map 17, includes several pipelines that have either been proposed or are under construction. It is notable just how much of the proposed new capacity is centered on extracting the Bitumen from the Athabascan Tar Sands deposits in Northern Alberta. These pipelines include the Trans Mountain Pipeline that runs from Edmonton, Alberta to Burnaby, British Columbia and Anacortes, Washington, now under construction. That route provides the shortest route to an ocean outlet, where tankers can be loaded to transport the Bitumen, or some refined product made from the Bitumen, to foreign markets. The Enbridge Gateway is a proposed pipeline project that runs Northwest from Edmonton, Alberta to Kitimat, British Columbia, also allowing for the loading of Oil Tankers in Pacific waters.
Map 17: Some of the Various Proposed and Under Construction Pipelines of North America
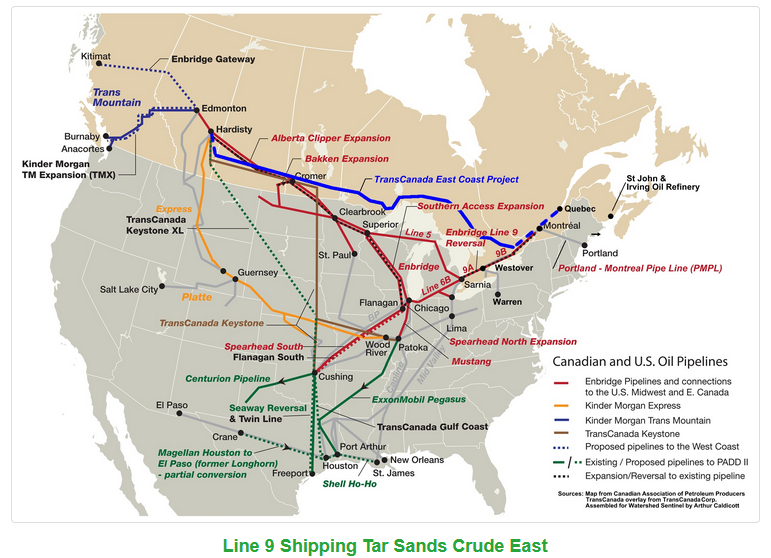
(Map 17 Source: “Enbridge Gas Pipeline Map {Page 1}”, Map: Line 9 Shipping Tar Sands Crude East, at < https://line.17qq.com/articles/dlplpplcv.html >)
We should also note that the TransCanada East Coast Project, that goes east from Hardisty, Alberta through southern Manitoba, Saskatchewan, and Ontario (north of Lake Superior) that is noted on Map 17 would provide Enbridge with a pipeline to transport Athabascan Bitumen to Atlantic Ports. It would tie in to the existing Line 9 about midway between Toronto and Montreal. As far as I can tell the TransCanada East Coast Project, might have been abandoned; it is not mentioned in any Enbridge information release I can find. If anything this increases the need for Enbridge and the other players in the Athabascan Tar Sands operation to move the Bitumen through Michigan in Line 5 and through Wisconsin, Illinois, Indiana and Michigan in Lines 61 / 6A to Line 6B. Enbridge stated that: “The multibillion-dollar Line 3 Replacement Program (L3RP), running from Hardisty, AB to Superior, WI, is the largest project in Enbridge history.”55; the Candian segment alone cost over $5.9 Billion. Line 3 feeds into Lines 5 and 6B. Enbridge is also working on expanding the capacity of Line 9 that is fed by Lines 5 and 6B, and that runs from Sarnia, Ontario to Montreal, Quebec. There Line 9 connects with the Portland - Montreal Pipeline, and transports the Alberta Athabascan Bitumen to an Atlantic Shipping port. This entire project relies greatly on moving Dilbit through lines 5 and 6B, and crossing Lake Huron near Sarnia, and for Line 5 the Straits of Mackinac.
Map 18: Another View of Pipelines Planned for Operation by 2020.
Including the Locations of Various Extreme Oil Sources
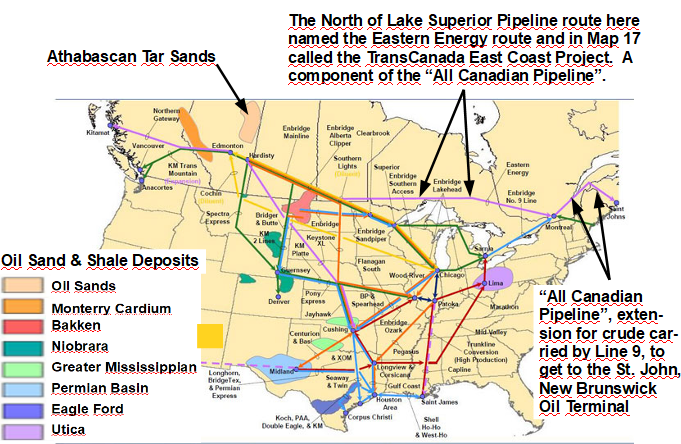
(Map 18 source: “State of Pipelines”, “Current State of U.S. Pipeline Infrastructure”, Map: Expected North American Crude Oil Pipelines 2020 (date of the map, 2012), Energy Infrastructure, at < https://energyinfrastructure.org/pipeline/state-of-pipelines >, arrows to and labels for the various pipelines and the Athabascan Tar Sands added by the author)
Map 18, along with Map 17 shows the location of both various existing and proposed pipelines. The “Eastern Energy Pipeline” shown on Map 17 is roughly equivalent to the TransCanada East Coast Project, on Map 18. It was envisioned here immediately above in Map 18 as connecting to the Line 9 system at Montreal, rather than between Toronto and Montreal, closer to Toronto, as for the TransCanada East Coast Project. Also the Eastern Energy Pipeline appears to connect into Line 3 fairly close to the U.S. border at North Dakota. Another interesting variant seen on Map 18 is the north eastern extension of Line 9 along the southern shore of the St. Lawrence River and then with a SE line to St Johns, New Brunswick, reaching Atlantic oil terminal and port access there. Map 18 shows the location of the major “extreme oil and natural gas deposits” in North America. Also of interest is the designation (listed between the two arrowheads that touch the Eastern Energy Pipeline) of Enbridge Lakehead. This designation of “Enbridge Lakehead” refers to Lines 5, 6B, and 61 / 6A.
Map 19: Major Enbridge Pipeline Systems, Existing and Proposed for Eastern and South Central North America
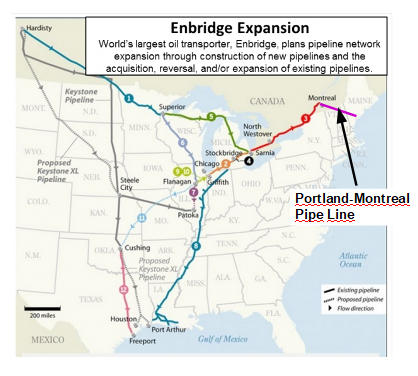
(Map 19 source: "Enbridge Gas Pipeline Map {Page 1}", Map: “New Pipeline Across Missouri, Illinois Is A Lot Like Keystone”, at < https://line.17qq.com/articles/dlplpplcv.html >, the Portland-Montreal Pipe Line was added by the author)
Map 19 is a very useful map because it has the virtue of being uncluttered enough to clearly present several important Enbridge Pipelines. However, there is a certain amount of unfortunate and easily avoidable confusion in the labelling of the Pipelines in Map 19 and the Table to Accompany Map 19 here below. The aquamarine line labeled 1 is actually Pipe Line 3. The light brown line, labeled 2 is actually Pipe Line 6B. The red line labeled 3 is actually Pipe Line 9. The green line labeled 5 is in fact Pipe Line 5. The grayish blue line labeled 6 is Pipe Line 61 / 6A that connects Pipe Line 3 with Pipe Line 6B.
Table to Accompany Map 19
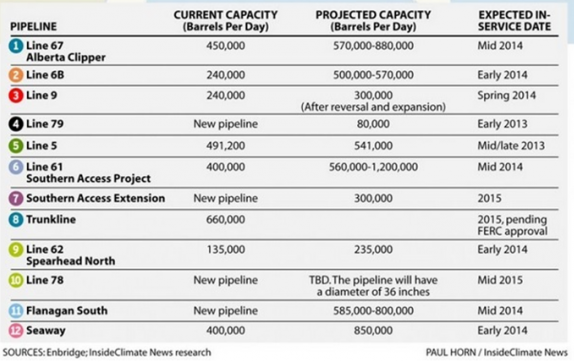
(Table to Accompany Map 19 Source: "Enbridge Gas Pipeline Map {Page 1}", Map: “New Pipeline Across Missouri, Illinois Is A Lot Like Keystone”, at < https://line.17qq.com/articles/dlplpplcv.html >)
The Keystone Pipeline is operational, it is more easily visible in Map 19 than in Maps 17 or 18. It is the gray line that runs from Hardisty, Alberta, through Steele City, Kansas and continues on to Cushing, Oklahoma; where it connects into the Seaway Pipeline. It was also known as the Dakota Access Pipeline, and the extended protests and operations of the WaterKeepers and their supporters in the last year or so of the Obama Administration tried to block it, with some success. Trump increased the use of Federal Law Enforcement against the Water-Keepers and was supportive of increased use of private thugs, state police, and the passage of the law that made it legal for motorists to run down protesters on State Highways in South Dakota. These hardline tactics ensured that the Keystone/Dakota Access Pipeline was built.
However, the Keystone XL labeled the ”Proposed Keystone XL Pipeline” in Map 15 has not yet been built and was in fact blocked by President Biden on his first day in office as noted above. There is absolutely no sign of the TransCanada East Coast Project on Map 17. Map 20 below, that was updated in 2019, reinforces the impression that both interations of a north of Lake Superior pipeline, the TransCanada East Coast Project / Eastern Energy Pipeline have been abandoned for the time being. The presence of Lines 3, 5, 6B, 9, 61, and the Portland-Montreal Pipe Line are all easily discernible, but the TransCanada East Coast Project / Eastern Energy Pipeline is nowhere to be seen.
Map 20: East - West Pipelines in the MidWest
and Great Lakes Region
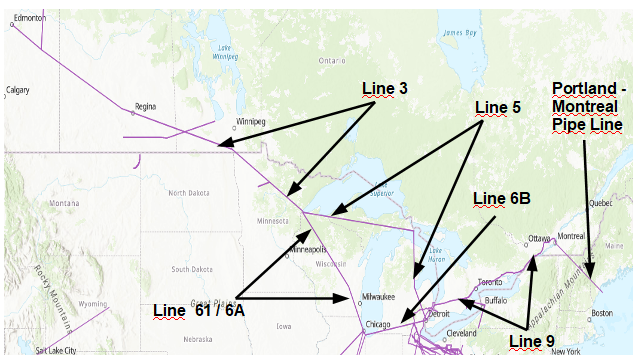
(Map 20 source: “North American Pipeline and Oil & Gas Infrastructure Proposals”, Feb 5, 2014, Updated: Mar 14, 2019, waauch, GIS Layer “Midwest East-to-West Pipeline Proposals”, at < https://www.arcgis.com/home/webmap/viewer.html?layers=6f2813e77495497c928c5d442cccfda0 > , arrows to and labels for the various pipelines added by the author)
Part 6: The Great Lakes in the Larger Oil Picture. The Lakehead Pipelines and the Potential Stranding of the Athabascan Tar Sands.
Map 21: Line 3, and Lines 5, 6B, 9, 61, and the Portland-Montreal Pipe Line: and One of the Plans to Export Athabascan Bitumen
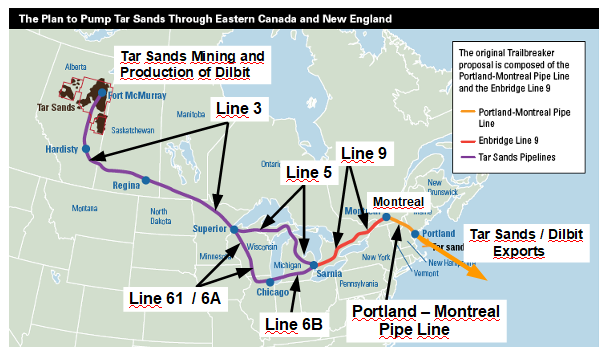
(Map 21 source: "Enbridge Line 5 Tribes and Michigan Communities say NO!", n.d., anon., The Water's Edge, at < http://www.savethewatersedge.com/whoa---bring-your-horses/oil-spills---no-more-foreve/enbridge-line-5-tribes-and.html >, arrows to and labels for the various pipelines added by the author)
What is actually going on here is a desperate attempt to keep the Athabascan Tar Sands Bitumen from becoming a stranded resource and a campaign to sell as much of that oil as quickly as possible . Map 21 shows the quickest, and also the most dangerous, pipeline system to move Bitumen out to an Atlantic Oil Depot at Portland, Maine. The is the system of pipelines that is in operation now. This operation has the virtue, for Enbridge Energy and the various oil producing companies, that the pipelines to move the Athabascan Bitumen are already in operation and are freely available to move whatever product out for sale on world markets. That danger from this operation is that it depends on moving Dilbit and other extreme oils across the Great Lakes, once on the Line 3 - Line 61 / 6A - Line 6B - Line 9 route. The Line 9 - Line 5 - Line 9 route involves crossing the Great Lakes twice, the first time in the 67 year old Line 5 at its structurally deficient and damaged Straits of Mackinac crossing. The legend for Map 21 is misleading; in that it uses purple to designate "Tar Sands Pipelines". Much of the purple colored pipeline mileage in the map consists of old pipelines, that were not purpose built to carry Bitumen. The entire roughly square shaped set of pipelines with corners at Superior, Wisconsin, the North Eastern Upper Peninsula of Michigan, Sarnia, Ontario, and a point about 50 miles west of Chicago contains many miles of old pipelines. Enbridge finished extensive “upgrades'' to Line 6B in the 3 years following the Marshall, Michigan / Kalamazoo Oil Spill Disaster. There are no major upgrades underway or planned for Lines 5 and/or 61 / 6A as far as I can determine.
The Enbridge Line 9 segment from Sarnia to Montreal, on Maps 19 and 21 in red, was built in 1975 and came into operation in 1976. “At that time, it was owned and operated by Interprovincial Pipe Line Ltd.” The pipeline was purchased “... by Interprovincial Pipe Line System Inc. in 1992 …” that company changed its name twice to become Enbridge Pipelines Inc in 1998. The line was designed to have its flow be easily reversible and for the first 20 years oil flowed from west to east, then for the 15 years the oil in Line 9 moved from east to west.56 On November 9, 2012, Enbridge applied for and later received permission from the Canada Energy Regulator, to: “... to reverse a segment of Line 9 between North Westover, Ontario and Montreal, Québec, in addition to requesting a capacity expansion for the entire Line 9 from Sarnia, Ontario to Montreal, and a revision to the Line 9 Rules and Regulations Tariff to allow transportation of heavy crude. Subsequent to this Enbridge also requested an exemption from certain requirements under the Oil Pipeline Uniform Accounting Regulations and the Board’s Filing Manual.”57 In addition, after securing official permission: “On December 1, 2015, Enbridge reversed a 639 km-long section of Line 9 from North Westover to Montreal (Line 9B) in an eastward direction … (the pipeline, dm) is capable of transporting heavy crudes that meet Enbridge’s quality standards.”58 Enbridge divided Line 9 into Line 9A, that runs from Sarnia to Westover, and Line 9B that runs from Westover to Montreal. The flow reversal was implemented for the entire Line 9, but capacity increases were only scheduled for Line 9A. Enbridge claims that Line 9B is capable of safely “transporting heavy crudes that meet Enbridge’s quality standards”, without undergoing replacement of the old pipeline. Another key component, the Portland - Montreal Pipe Line was actually completed in 1941 (that makes the Portland - Montreal Pipe Line 70 years old). Enbridge requested and obtained Canadian Government permission to reverse its flow; it is now in operation moving material, largely Athabascan Tar Sands “DilBit” to the harbor at Portland, Maine. From there it is moved in oil tankers to various foreign markets including Atlantic ports in the U.S
Map 22: Line 9, the Lynchpin of the Enbridge Athabascan Bitumen Transport and Marketing Operation
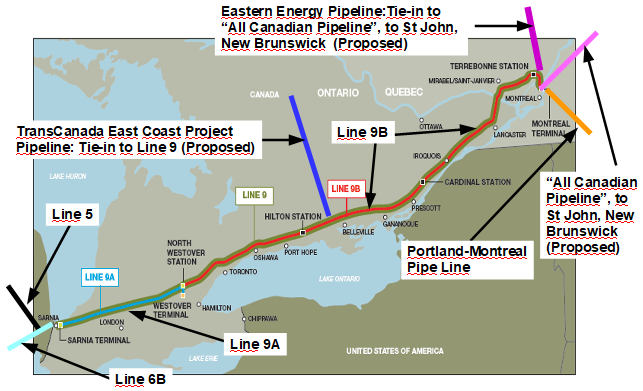
(Map 22 source: “Line 9B Reversal and Line 9 Capacity Expansion Project”, Enbridge, at < https://www.enbridge.com/ECRAI.aspx >, Other pipeline segments, both existing and proposed, arrows to those pipelines, and labels all added by the author, The term “All Canadian Pipeline” is an appellation of the author, it describes the Alberta to Eastern Canada route, but is not a name used by Enbridge or Canadian Government Agencies)
To collect the profits from a few years of oil sales, to prop up their balance sheets, the various Fossil Fuel interests are willing to gamble on doing grievous damage to the Great Lakes. Those lakes are an enormous gift of nature that hold 21% of all the surface freshwater on the entire planet, and that is the drinking and other water source for over 40 million people in the U.S. and Canada. Much of the pipeline mileage that would be used for this harebrained operation is not purpose built to transport Bitumen and there would be numerous spills and leaks. But for the Fossil Fuel interests these are "externalities", costs that can be foisted off onto the general public. The other proposals, to build a pipeline entirely in Canada, and north of Lake Superior TransCanada East Coast Project / Eastern Energy Pipeline are apparently on hold for now. Implementing that project that would be far more expensive and would take many years to build, but the threat by the Governor of Michigan to shut down Line 5 could force the hands of Enbridge and the Petroleum companies.. The Fossil Fuel interests know that the world is beginning to move away from burning their various products for power and think they must implement this project as quickly as possible to maximize their profits.
At this point the Keystone XL Pipeline is blocked, the Trans Mountain Pipeline to the Pacific is still under construction, and the Northern Gateway Pipeline is still just a proposed project. So the only currently functioning pipeline system that allows significant amounts of Athabascan Bitumen to be moved out of Alberta is the “Enbridge Lakehead” system, including Lines 5 and 6B.
One of the key components that makes it possible for the Enbridge Lakehead pipeline system to move the Tar Sands out is Line 9, that crosses Southeastern Ontario from Sarnia and arrives in the Montreal, Quebec area. Maps 19 shows how Line 9 fits into the overall picture. Including places where one or the other of the All Canadian pipeline route the TransCanada East Coast Project / Eastern Energy Pipelines would potentially connect into Line 9. Enbridge has been busy upgrading and replacing some stretches of Line 9.
Map 23: Line 9 Through SouthWestern Ontario. Including Connections with Other Existing and Proposed Pipelines
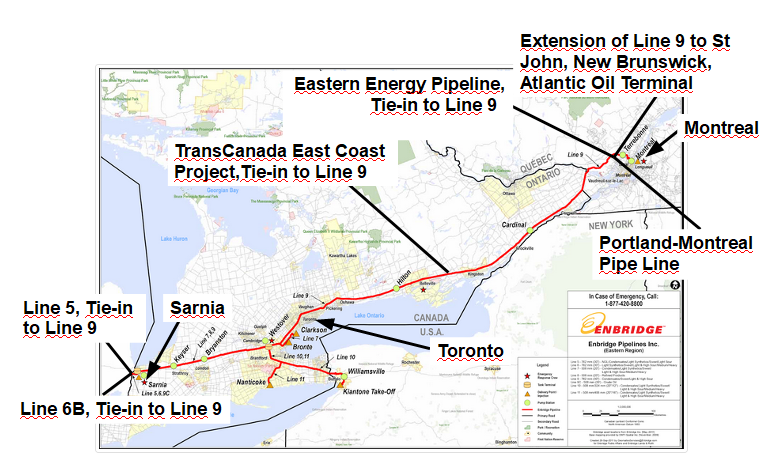
(Map 23 source: "Enbridge Gas Pipeline Map {Page 1}", Map: “Ontario Energy Strategy: Nine New Unconventional Oil & Gas Pipelines”, at < https://line.17qq.com/articles/dlplpplcv.html >)
Conclusions
The main conclusion to all this is that the evidence is very clear. All the ongoing Enbridge pipeline upgrades and renovations are nearly exclusively being undertaken to transport as much of the Athabascan Tar Sands Bitumen out of Canada as quickly as possible, and to sell it on the world oil markets. This is not the result of any sort of rational national policy in either the U.S. or Canada, but is rather an attempt to maximize the profits accruing various Fossil Fuel tycoons. The main route to get the Athabascan Tar Sands Bitumen out is across the Great Lakes on Lines 3 - 5 - 9 and the Portland - Montreal Pipe Line, or on Lines 3 - 61/6A - 6B - 9, and the Portland - Montreal Pipe Line. The major work on Line 3, Line 6B, and Line 9 all indicate that Enbridge and the oil producers intend to use this route just as much as they possibly can. The glaring fact that Enbridge is not planning or conducting any major work on Line 5, other than the Pipeline Tunnel proposal for the Mackinac Straits crossings, shows that they are very concerned that the Governor of Michigan, Gretchen Whitmer, will be successful in her attempt to close Line 5 at the Straits of Mackinac. This would go a long way towards shutting down the Enbridge Lakehead operation. Public pressure would probably build next to shut the pipeline where it crosses at Port Huron, Michigan / Sarnia, Ontario. An oil spill there would be disastrous as well, the spot is not as iconic as the Straits of Mackinac are to the general public, but success in closing Line 5 at the Straits would buoy up the closure movement.
The developments with the Enbridge Pipeline system shows the position of Canada in the Global Capitalist hierarchy. Canada functions largely as a resource extraction and export economy. Mining and other resource extraction companies operating in Canada are very aggressive and ruthless in their pursuit of profits; that they obtain by extracting resources to sell on global markets regardless of the consequences for most Canadians. The ongoing increase in Canadian crude oil exports is demonstrated in Figure 11 below, nearly all of it is obtained from the Athabascan Tar Sands deposits, and moved out via Lines 3, 5, 61/6A, 6B, 9, and the Portland - Montreal Pipe Line If it is possible to move material through the U.S. enroute to deliver it to those markets, companies like Enbridge are not shy about running such operations. The potential disastrous consequences for the people of the Great Lakes region, in both the U.S. and Canada, are not even a consideration.
Figure 11: Canadian Oil Exports 2004 - 2019. Thousand Barrels per day
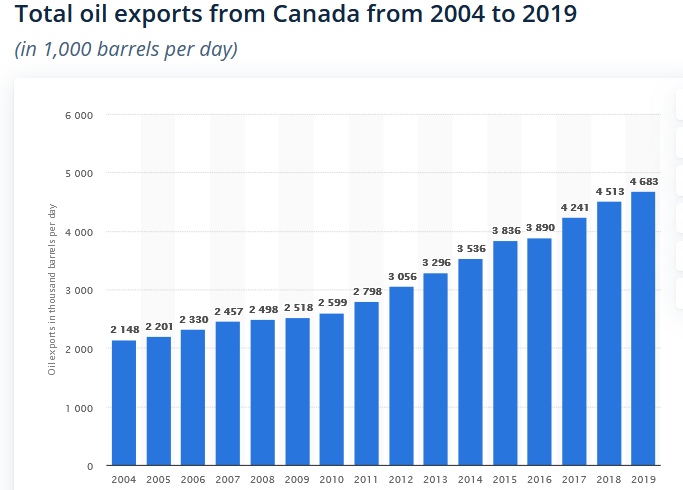
(Figure 11 source: “Total oil exports from Canada from 2004 to 2019: (in 1,000 barrels per day)”, Sep 11, 2020, N. Sönnichsen, Statistica, at < https://www.statista.com/statistics/265309/canada-exports-of-crude-oil/ >)
The U.S. has been moving downwards in the capitalist economic hierarchy and much of its economy is now oriented towards resource extraction and the sale of commodities on world markets. Figure 12 below shows how, after the oil extraction interests sponsored legislation to lift limits on oil exports in 2015, the U.S. has become a significant oil exporting country moving out over a million barrels a day by 2017. Again these operations are run regardless of the consequences for such national assets as the people who live near any of their operations, or the waters of the Great Lakes. One of the consequences of the last 20+ years of wars in the Global War on Terrorism was to see U.S. petroleum and natural gas companies displaced from the richest oil and gas territories in the Middle East. Their response has been to develop various types of extreme fossil fuel deposits, such as deep sea oil fields in the Gulf of Mexico, and low quality deposits like the Baaken, and other shales that use hydraulic fracturing to extract the oil, and the Athabascan Tar Sands with its many drawbacks and costs.
Figure 12: U.S. Oil Exports 1990 - 2018
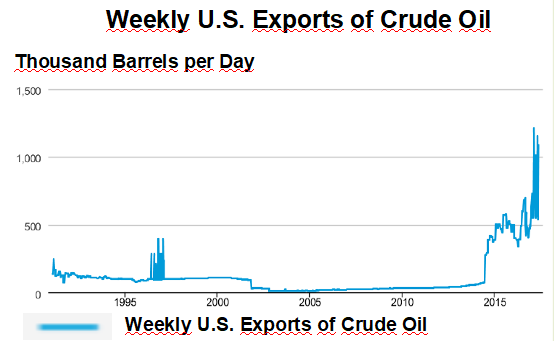
(Figure 12 source: “What happened when we lifted the 2015 crude oil export ban?”, Feb 21, 2019, anon, pg. 20 SOIL, Illinois Capa Pipelines CAPA, Evanston)
The continued exploitation of the Athabascan Tar Sands is one of the most dangerous environmental operations taking place on the face of the Earth. Many of the hydraulic fracturing operations in North America are running up against their limits. High yields of oil or gas usually last only for about a year and then begin to fall rapidly. When these frackers move on to new areas they leave behind environmental and social devastation. Other potential fracking operations cannot take place because there is nowhere near the required amount of water available to run the extraction processes. This has been the case for the Oil Shale in Colorado for one example. The Athabascan Tar Sands are a huge deposit. As long as the mining, refining, and transportation companies can make a profit they will keep extracting and selling that resource, regardless of the consequences for the people or the societies involved. The Athabascan Tar Sands are located in a remote area that only a small indigenous population personally knows or directly cares about. Moving the material out and later refining it collides with much larger portions of the Canadian and American populations. Enbridge is feverishly working to build a way to move the Bitumen to Canada’s Pacific Coast, and to refine and export it from there. Canadian environmental groups and indigenous peoples are still resisting that process to the extent that they can. Despite the attempts to build yet more pipelines to move Bitumen to the Texas Gulf Coast the Keystone XL Pipeline has now been, for the time being, blocked by an Executive Order by President Biden. So for the next few years the Eastern Route, that crosses the Great Lakes, is the only functioning route to move Bitumen to market. That operation is threatened by Michigan Governor Gretchen Whitmer’s executive order revoking Enbridge’s 1953 easement to move material under Lake Huron in Line 5 at the Straits of Mackinac.
This is entirely speculative: but I think it is worth considering that the likelihood that the death threats and assassination plots against Governor Whitmer were no doubt motivated, at the deep capitalist level, as much or more by her ongoing actions to end the operation of Line 5 as it was by "mask wearing" and “small business closures”. Even though the far-right ground troops who occupied the Michigan State Capitol were largely fired up by the mask and business closure issues, wealthy operatives are well versed in using "culture war" issues to motivate their "grass roots" allies and supporters to take actions with very different real agendas.
Looking at the larger world water situation a few questions come to the fore. The poor would benefit from increases in efficiency in the use of water. But not at the cost of monetizing water and turning it over to private speculators and financial markets. This is the current trend, though it has been set back to some degree by popular resistance. It will continue to be necessary to use large amounts of water for agriculture, this averages at around 70% - 80% of humanity’s water usage. The investments needed to bring reasonably priced good quality water to the growing populations of the urban poor in the “Global South” would pay off just in the reduction of water based communicable diseases and the improvements in cleanliness many poor people could reach if they had access to enough clean water. Currently the rich often pay less for much more plentiful and higher quality water than do the poor. There are no panaceas but the one massive water resource that is not currently in use is iceberg harvesting. A major research and development effort in that area could reduce water stress in some areas.
Glossary
All Canadian Pipeline: This is a phrase I created to describe any variant of a pipeline that transports Athabascan Tar Sands Dilbit from Alberta to an oil port and terminal in St John, New Brunswick or any other Canadian Atlantic port. The main objective of an “All Candian Pipeline” would be to quit crossing U.S. territory, where American politics and regulations must be contended with. The most immediate issue is using the 2 pipelines that cross submerged in the waters of the Great Lakes. The “All Canadian Pipeline” is a project that could be revived if serious legal hurdles are placed against continued operation of current Enbridge Pipelines, such as Line 5 and Line 6B. So one variant of the “All Candian Pipeline'' could use the Portland - Montreal Pipe Line. That pipeline currently moves Dilbit to an oil terminal in Portland, Maine; from which it is shipped to world markets. A longer pipeline to St John, New Brunswick could avert crossing U.S. territory completely.
Athabascan Tar Sands: Low quality oil impregnated sands found in Northern Alberta Canada. They are mined, heated, and processed to produce Bitumen.
Bitumen: The form of crude oil produced by preliminary processing of the Athabascan Tar Sands. It is similar to asphalt, is highly corrosive, is the consistency of peanut butter, and is still full of sand.
DilBit: Diluted Bitumen, the Bitumen produced from the Athabascan Tar Sands is too dense and corrosive to transport without being first diluted with much lighter petroleum solvents. Bitumen is mostly diluted with Benzene, and the final Dilbit is 30% Benzene.
EROI (Energy Return on Investment): The ratio of amount of energy that is obtained, as compared to that which must be used to obtain that energy, from any given source.
Fracking (Hydraulic Fracturing): A method of extraction for oil or natural gas in which water impregnated with various additives is used to fracture rock strata and allow the oil or gas found there to be pushed out with more water and hydraulic processes. The companies that use this technique use on average around 300 different chemical additives during different parts of the process. They select from a menu of over 600 chemical additives, that are secret because they are considered to be Proprietary parts of a companies operations. Most of the chemical additives, however, have been identified by forensic chemists who examined wells or rock strata. Fracking is generally associated with trying to extract marginal resources, and depends economically on foisting as much of the cost of these operations as possible on the surrounding land owners and general public in what are referred to as “externalities”. In most cases fracking wells are rapidly depleted, usually maintaining peak production only for a year or two, and new fracking wells must constantly be drilled.
PCBs: Polychlorinated Biphenyls. Toxic organic compounds used for various industrial purposes. They were mostly used for insulation in electrical equipment, large transformers in our cities and towns are full of them. There were always various leaks but somehow animal feed in Michigan was contaminated with PCBs and got into the meat of the animals fed that contaminated animal food. There is a significant amount of PCBs that got into the Great Lakes, especially near industrial areas.
PHMSA: The U.S. Pipeline and Hazardous Materials Safety Administration (PHMSA), which is a federal agency under the Department of Transportation that enforces pipeline safety rules and regulations. Generally regarded as a weak, overwhelmed, and understaffed regulatory agency.
Pipelines: There are several existing pipelines discussed in the article. Line 3 runs from the Alberta Tar Sands area to Superior, Wisconsin. Line 5 runs through Wisconsin and the Upper Peninsula of Michigan to Port Huron, Michigan / Sarnia, Ontario. Lines 61 / 6A and 6B run through Wisconsin, Illinois, Indiana, and Lower Michgan to Port Huron, Michigan / Sarnia, Ontario. Lines 5 and 6B connect with Line 9 that runs from Sarnia, Ontario to Montreal, Quebec. Line 9 connects with the Portand - Montreal Pipe Line that runs to Portand, Maine, and an oil terminal there that allows for loading oil tankers. There are several pipelines that either are under construction or have been proposed that are discussed in the article.
Watershed: Is an area of land that drains all the streams and rainfall to a common outlet, such as the outflow of a reservoir, mouth of a bay, the ocean, or a lake.
References:
1). “Where is Earth's Water?”, USGS, at < https://www.usgs.gov/special-topic/water-science-school/science/where-earths-water?qt-science_center_objects=0#qt-science_center_objects >: Original source: Igor Shiklomanov’s Chapter “World Freshwater Resources”, in Peter H. Gleick, ed., 1993, Water in Crisis: A Guide to the World’s Freshwater Resources.
2). “List of lakes by volume”, n.d., anon., Wikipedia, at < https://en.wikipedia.org/wiki/List_of_lakes_by_volume >: “A global inventory of lakes based on high-resolution satellite Imagery”, 2014, Verpoorter, C., T. Kutser, D. A. Seekell, and L. J. Tranvik, Geophysical. Research. Letters, Vol 41, pp. 6396–6402, doi:10.1002/2014GL060641: “117 Million Lakes Found in Latest World Count”, Sep 15, 2014, Lisa Borre, National Geographic Society, at < https://blog.nationalgeographic.org/2014/09/15/117-million-lakes-found-in-latest-world-count/ >: “Where is Earth's Water?”, USGS, at < https://www.usgs.gov/special-topic/water-science-school/science/where-earths-water?qt-science_center_objects=0#qt-science_center_objects >: Original source: Igor Shiklomanov’s Chapter “World Freshwater Resources”, in Peter H. Gleick, ed., 1993, Water in Crisis: A Guide to the World’s Freshwater Resources.
3). “Estimating the volume and age of water stored in global lakes using a geo-statistical approach”, Dec 15, 2016, Mathis Loïc Messager, Bernhard Lehner, Günther Grill, Irena Nedeva & Oliver Schmitt, Nature Communications, volume 7, Article number 13603, at < https://www.nature.com/articles/ncomms13603 >: “Taking stock of the world's lakes: New global database will help scientists track role of lakes in Earth's ecology”, Dec 15, 2016, McGill University, at < https://www.eurekalert.org/pub_releases/2016-12/mu-tso121216.php >.
4). “A global inventory of lakes based on high-resolution satellite Imagery”, 2014, Verpoorter, C., T. Kutser, D. A. Seekell, and L. J. Tranvik, Geophysical. Research. Letters, Vol 41, pp. 6396–6402, doi:10.1002/2014GL060641:“117 Million Lakes Found in Latest World Count”, Sep 15, 2014, Lisa Borre, National Geographic Society, at < https://blog.nationalgeographic.org/2014/09/15/117-million-lakes-found-in-latest-world-count/ >: “Where is Earth's Water?”, USGS, at < https://www.usgs.gov/special-topic/water-science-school/science/where-earths-water?qt-science_center_objects=0#qt-science_center_objects >: Original source: Igor Shiklomanov’s Chapter “World Freshwater Resources”, in Peter H. Gleick, ed., 1993, Water in Crisis: A Guide to the World’s Freshwater Resources: “List of lakes by volume”, n.d., anon., Wikipedia, at < https://en.wikipedia.org/wiki/List_of_lakes_by_volume >.
5). “Estimating the volume and age of water stored in global lakes using a geo-statistical approach”, Table 1 Distribution and morphometric characteristics of lakes worldwide, Dec 15, 2016, Mathis Loïc Messager, Bernhard Lehner, Günther Grill, Irena Nedeva & Oliver Schmitt, Nature Communications, volume 7, Article number 13603, at < https://www.nature.com/articles/ncomms13603 >: “Taking stock of the world's lakes: New global database will help scientists track role of lakes in Earth's ecology”, Dec 15, 2016, McGill University, at < https://www.eurekalert.org/pub_releases/2016-12/mu-tso121216.php >.
.
6). “The Many Failures and Few Successes of Zany Iceberg Towing Schemes”, Aug 2011, Alexis C. Madrigal, The Atlantic, at < https://www.theatlantic.com/technology/archive/2011/08/the-many-failures-and-few-successes-of-zany-iceberg-towing-schemes/243364/ >: “As South Africa faces ever more severe water shortages, some experts are seriously considering a proposal to harvest Antarctic icebergs and haul them to Cape Town. What are the chances it will succeed?”, Sep 21, 2018, Tim Smedley, BBC Future, at < https://www.bbc.com/future/article/20180918-the-outrageous-plan-to-haul-icebergs-to-africa >: “This Country Wants to Tow Icebergs From Antarctica to the Middle East As early as 2018”, May 5, 2017, Robbie Gramer, Foreign Policy – The Cable, at < https://foreignpolicy.com/2017/05/05/this-country-wants-to-tow-icebergs-from-antarctica-to-the-middle-east/ >: “An engineering firm wants to tow icebergs thousands of miles from Antarctica to quench the driest areas of the world — and it's starting with Dubai”, Sep 8, 2018, Jeremy Berke, Business Insider, at < https://www.businessinsider.com/engineering-firm-tow-icebergs-antarctica-for-water >: Antarctic Icebergs as a Global Fresh Water Source, Oct 1973, J.L. Hult & N.C. Ostrander, Rand Corp., National Science Foundation.
7). “The Many Failures and Few Successes of Zany Iceberg Towing Schemes”, Aug 2011, Alexis C. Madrigal, The Atlantic, at < https://www.theatlantic.com/technology/archive/2011/08/the-many-failures-and-few-successes-of-zany-iceberg-towing-schemes/243364/ >: “As South Africa faces ever more severe water shortages, some experts are seriously considering a proposal to harvest Antarctic icebergs and haul them to Cape Town. What are the chances it will succeed?”, Sep 21, 2018, Tim Smedley, BBC Future, at < https://www.bbc.com/future/article/20180918-the-outrageous-plan-to-haul-icebergs-to-africa >: “This Country Wants to Tow Icebergs From Antarctica to the Middle East As early as 2018”, May 5, 2017, Robbie Gramer, Foreign Policy – The Cable, at < https://foreignpolicy.com/2017/05/05/this-country-wants-to-tow-icebergs-from-antarctica-to-the-middle-east/ >: “An engineering firm wants to tow icebergs thousands of miles from Antarctica to quench the driest areas of the world — and it's starting with Dubai”, Sep 8, 2018, Jeremy Berke, Business Insider, at < https://www.businessinsider.com/engineering-firm-tow-icebergs-antarctica-for-water >: Antarctic Icebergs as a Global Fresh Water Source, Oct 1973, J.L. Hult & N.C. Ostrander, Rand Corp., National Science Foundation.
8). “In a warming world, Cape Town’s ‘Day Zero’ drought won’t be an anomaly, Stanford researcher says”, Nov 9, 2020, Danielle Torrent Tucker, Stanford News, at < https://news.stanford.edu/2020/11/09/cape-towns-day-zero-drought-sign-things-come/ >: “Awaiting Day Zero: Cape Town Faces an Uncertain Water Future”, Mar 1, 2018, Adam Welz, Yale Environment 360, at < https://e360.yale.edu/features/awaiting-day-zero-cape-town-faces-an-uncertain-water-future >: “Day Zero: when is it, what is it, and how can we avoid it?”, Nov 15 2017, Statement by the City's Executive Mayor, Patricia de Lille, City of Capetown, at < https://www.capetown.gov.za/Media-and-news/Day%20Zero%20when%20is%20it,%20what%20is%20it,%20and%20how%20can%20we%20avoid%20it >: “What's Actually Behind Cape Town's Water Crisis”, Feb 15, 2018, Richard Poplak, The Atlantic, at < https://www.theatlantic.com/international/archive/2018/02/cape-town-water-crisis/553076/ >: “Chennai, India, is almost out of water. Satellite images show its nearly bone-dry reservoirs”, Jun 20, 2019, Paul P. Murphy & Gianluca Mezzofiore, CNN, at < https://www.cnn.com/2019/06/20/world/chennai-satellite-images-reservoirs-water-crisis-trnd/index.html >: “Chennai’s Day Zero: It’s not just meteorology but mismanagement that’s made the city run dry”, Jun 28, 2019, K. Lakshmi, The Hindu, at < https://www.thehindu.com/sci-tech/energy-and-environment/chennais-day-zero-its-not-just-meteorology-but-mismanagement-thats-made-the-city-run-dry/article28197491.ece >: “The Water Crisis In Chennai, India: Who's To Blame And How Do You Fix It?”, Jul 18, 2919, Lauren Frayer, National Public Radio, at < https://www.npr.org/sections/goatsandsoda/2019/07/18/742688141/the-water-crisis-in-chennai-whos-to-blame-how-do-you-fix-it >: “The global fight over water”, Mar 21, 2021, DW Documentary, at < https://www.youtube.com/watch?v=5oyFRoxuf4g >.
9). “The global fight over water”, Mar 21, 2021, DW Documentary, Deutsche Welle, at < https://www.youtube.com/watch?v=5oyFRoxuf4g >.
10). “Leasing the rain; the world is running out of fresh water, and the fight to control it has begun”, Apr 8, 2002, William Finnegan, The New Yorker, Vol. 78, Issue 7.
11). “Cochabamba: The First Water War of the 21st Century”, Mar 30, 2021, Anselmo Cassiano, History Design Studio, at < https://historydesignstudio.com/features/cochabamba-the-first-water-war-of-the-21st-century >:
12). “Cochabamba Water War”, Wikipedia, at < https://en.wikipedia.org/wiki/Cochabamba_Water_War >: “Leasing the rain; the world is running out of fresh water, and the fight to control it has begun”, Apr 8, 2002, William Finnegan, The New Yorker, Vol. 78, Issue 7.
13). “Hopes For A Rainy Day: A History of Bolivia's Water Crisis”, Jul 2, 2020, Nithyani Anandakugan, Harvard Int'l Rev, < https://hir.harvard.edu/hopes-for-a-rainy-day-a-history-of/ >: “Resilient Bolivia, an example to overcome the water crisis”, Mar 10, 2017, anon., We Are Water, at < https://www.wearewater.org/en/resilient-bolivia-an-example-to-overcome-the-water-crisis_280381 >: “From Water Wars to Water Scarcity: Bolivia’s Cautionary Tale”, Jun 5, 2013, Emily Achtenberg, NACLA, at < https://nacla.org/blog/2013/6/5/water-wars-water-scarcity-bolivia%25E2%2580%2599s-cautionary-tale >: “Bolivia: The water war to resist privatisation of water in Cochabamba”, (#157), Jan 25, 2017, Global Water Partnership, at < https://www.gwp.org/en/learn/KNOWLEDGE_RESOURCES/Case_Studies/Americas--Caribbean/bolivia-the-water-war-to-resist-privatisation-of-water-in-cochabamba-157/ >: “Cochabamba: The First Water War of the 21st Century”, Mar 30, 2021, Anselmo Cassiano, History Design Studio, at < https://historydesignstudio.com/features/cochabamba-the-first-water-war-of-the-21st-century >: “Impact story: Addressing a growing water crisis in Bolivia”, May 23, 2018, anon., Stockholm Environment Institute, at < https://www.sei.org/featured/growing-water-crisis-bolivia/ >: “A Personal View: The Water War in Cochabamba, Bolivia: Privatization Triggers an Uprising”, Feb 2003, Manuel de la Fuente, Mountain Research and Development,Vol. 23, No. 1, pp. 98-100.
14). “Cochabamba: The First Water War of the 21st Century”, Mar 30, 2021, Anselmo Cassiano, History Design Studio, at < https://historydesignstudio.com/features/cochabamba-the-first-water-war-of-the-21st-century >.
15). “Great Lakes”, Wikipedia, at < https://en.wikipedia.org/wiki/Great_Lakes >: “List of lakes by volume”, Wikipedia, at < https://en.wikipedia.org/wiki/List_of_lakes_by_volume >: “African Great Lakes”, Wikipedia, at < https://en.wikipedia.org/wiki/African_Great_Lakes >: “African Great Lakes”, Global Great Lakes, at < https://www.globalgreatlakes.org/agl/index.html >: “Lake Tanganyika”, Global Great Lakes, at < https://www.globalgreatlakes.org/agl/tanganyika/index.html >.
16). “The great siphoning: Drought-stricken areas eye the Great Lakes: 'Water, water everywhere' is the egalitarian vision of those who don't have enough of it and would like to tap the Great Lakes to get it.”, May 25, 2018, Ron Way, Minneapolis Star Tribune, at < https://www.startribune.com/the-great-siphoning-drought-stricken-areas-eye-the-great-lakes/483743681/ >: “Third Rail Proposal: Selling Great Lakes water proposed to lower lake levels”, Feb 18, 2020, Gary Wilson, Great Lakes Now, at < https://www.greatlakesnow.org/2020/02/selling-water-west-great-lakes-diversions/ >: “Great Lakes water piped to Southwest 'our future,' says NASA scientist”, Apr 10, 2017, updated Apr 11, 2017, Keith Matheny, Detroit Free Press, at < https://www.freep.com/story/news/local/michigan/2017/04/10/great-lakes-water-piped-southwest-our-future-says-nasa-scientist/100301326/ >: “The Lust for Great Lakes Water: Expert notes past attempts and future threats to five Great Lakes”, Apr 30th, 2018, Scott Gordon, Urban Milwaukee, at < https://urbanmilwaukee.com/2018/04/30/the-lust-for-great-lakes-water/ >: “Great Lakes Water Use and Diversions”, n.d., anon, Tip of the Mitt Watershed Council, at < https://www.watershedcouncil.org/great-lakes-water-use-and-diversions.html >:
“Shipping Great Lakes water? That's California dreaming”, Apr 19, 2015, Keith Matheny, Detroit Free Press, at < https://www.freep.com/story/news/local/2015/04/19/michigan-great-lakes-water/25965121/ >: “How long can Great Lakes fend off thirsty world from water diversions?”, Sept 4, 2018, Ron Seely, Bridge Michigan, at < https://www.bridgemi.com/michigan-environment-watch/how-long-can-great-lakes-fend-thirsty-world-water-diversions >: “Droughts and the Great Lakes: When dry regions get thirsty enough …”, Apr 24, 2015, The Editorial Board, Chicago Tribune, at < https://www.chicagotribune.com/opinion/editorials/ct-california-drought-great-lakes-water-compact-lake-michigan-edit-0426-bd-20150424-story.html >.
17). “Thirsty Future for American West, as 'Megadrought' Grips Some of the Fastest-Growing U.S. Cities”, May 7, 2020, Alexandra Tempus, FairWarning, at < https://www.fairwarning.org/2020/05/megadrought-american-west/ >.
18). “Adaptation to Future Water Shortages in the United States Caused by Population Growth and Climate Change”, Feb 28, 2019, Thomas C. Brown, Vinod Mahat & Jorge A. Ramirez, Earth’s Future, https://doi.org/10.1029/2018EF001091, at < https://agupubs.onlinelibrary.wiley.com/doi/full/10.1029/2018EF001091 >
19). “Great Lakes states sign off on water compact”, Jul 10, 2008, Updated Apr 04, 2019, Amy L. Payne | Booth Mid-Michigan, MLive, at < https://www.mlive.com/bctimes/2008/07/great_lakes_states_sign_off_on.html >: “PRESIDENT BUSH SIGNS GREAT LAKES COMPACT: Governors Applaud Historic Action to Protect the Lakes”, Oct 3, 2008, Council of Great Lakes Governors.
20). “Sea Lamprey Control Program”, U.S. Fish and Wildlife Service, at < https://www.fws.gov/midwest/SeaLamprey/index.html >.
21). “Invasive Sea Lamprey, A Slippery Great Lakes Fishery Issue”, Sep 9, 2018, Brandon Schroeder, Cory Brant, & Marc Gaden, Great Lakes Fisheries Heritage Trail, at < http://www.greatlakesfisheriestrail.org/collection.asp?ait=jv&jid=2 >)
22). “Sea Lamprey”, National Invasive Species Information Center, at < https://www.invasivespeciesinfo.gov/aquatic/fish-and-other-vertebrates/sea-lamprey >: “Sea Lamprey: The Greatest Invasive Control Success Story”, Jun 12, 2017, Kevin Bunch, Great Lakes Connection, International Joint Commission, at < https://www.ijc.org/en/sea-lamprey-greatest-invasive-control-success-story >: “Sea Lamprey Control in the Great Lakes: A remarkable success!”, Great Lakes Fishery Commission, at < http://www.glfc.org/control.php >.
23). “Dreissena polymorpha (Pallas, 1771)”, “Common Name: Zebra mussel”, Great Lakes Aquatic Non-Indigenous Species Information System (GLANSIS), at < https://nas.er.usgs.gov/queries/greatlakes/factsheet.aspx?speciesid=5&potential=n&type=0&hucnumber=dgreatlakes >: “A recent history of Great Lakes nonindigenous species”, Dec 5, 2019, Rochelle Sturtevant & El Lower, MSU Extension, Michigan Sea Grant, at < https://www.canr.msu.edu/news/a-recent-history-of-great-lakes-nonindigenous-species-msg19-sturtevant19 >: “Great Lakes Aquatic Invasive Species”, “Mapping the Spread of AIS”, The Nature Conservancy, at < https://www.nature.org/en-us/about-us/where-we-work/priority-landscapes/great-lakes/great-lakes-aquatic-invasive-species-/ >: “Welcome to the EDDMapS Midwest!”, at < https://www.eddmaps.org/midwest/ >: “Invasive Species: Great Lakes Region”, NOAA, at < https://www.regions.noaa.gov/great-lakes/index.php/great_lakes-restoration-initiative/invasive-species/ >: “Great Lakes Aquatic Nuisance Species Information System”, USGS, Wetland and Aquatic Research Center, at < https://www.usgs.gov/centers/wetland-and-aquatic-research-center-warc/science/great-lakes-aquatic-nuisance-species?qt-science_center_objects=0#qt-science_center_objects >: “Exotic Species and the Integrity of the Great Lakes”, Nov 1994, Edward L. Mills et. al., BioScience, Vol. 44, No. 10, pp. 666-676.
24). Our Great Lakes Commons: A Plan to Protect the Great Lakes Forever, 2011, Maude Barlow, Council of Canadians. There is a link to the report at “Report: Our Great Lakes Commons - A people’s plan to protect the Great Lakes forever”, Council of Canadians, at < https://canadians.org/report-our-great-lakes-commons >: Origin and Evolution of the Great Lakes, 2001, Grahame Larson and Randall Schaetzl, J. Great Lakes Res. V 27(4), pp. 518–546.
25). “Polychlorinated biphenyls”, n.d., anon, Great Lakes Mud, at < https://www.greatlakesmud.org/pcbs.html >. “Toxic Substances and Areas of Concern”, n.d. anon., NOAA, at < https://www.regions.noaa.gov/great-lakes/index.php/great_lakes-restoration-initiative/toxics/ >: “Chemical Pollution in the Great Lakes”, Feb. 9, 2017, Anna McCartney, NOAA, at < https://response.restoration.noaa.gov/about/media/chemical-pollution-great-lakes.html >. “Toxic Contamination Past and Present: Creating a Legacy”, Oct 4, 2020, anon., Alliance for the Great Lakes, at < https://greatlakes.org/2020/10/toxic-contamination-past-and-present-creating-a-legacy/ >: “Great Lakes Resource at Risk”, Mar 2005, Scott Fields, Environmental Health Perspectives; 113(3): A164–A173, at < https://www.ncbi.nlm.nih.gov/pmc/articles/PMC1253773/ >: “Great Lakes Pollution”, n.d., anon, Give Earth a Chance: Environmental Activism in Michigan, at < http://michiganintheworld.history.lsa.umich.edu/environmentalism/exhibits/show/main_exhibit/pollution_politics/great-lakes-pollution >.
26). “Mapping Environmental Stressors on the Great Lakes”, May 15, 2017, InfoSuperior, at < https://infosuperior.com/blog/2017/05/15/mapping-environmental-stessors-on-the-great-lakes/ >
27). “Report: Alberta’s Tailings Ponds”, n.d., anon., Environmental Defence, the website includes two live meters that record the ever growing volume of contaminated water in the Tailings Ponds and the ever growing public financial liability for its clean-up, at < https://environmentaldefence.ca/report/albertas-tailings-ponds/ >: One trillion litres of toxic waste and growing: Alberta’s tailings ponds, Report prepared by Environmental Defence and the Natural Resources Defense Council (NRDC), the website cited above has a link to download the report.
28). “Straits of Mackinac ‘worst possible place’ for a Great Lakes oil spill, U-M researcher concludes”, Jul 10, 2014, Jim Erickson, Michigan News, at < https://news.umich.edu/straits-of-mackinac-worst-possible-place-for-a-great-lakes-oil-spill-u-m-researcher-concludes/ >: and “Straits of Mackinac Contaminant Release Scenarios: Flow Visualization and Tracer Simulations”, May 16, 2014, David J. Schwab, Research Report for National Wildlife Federation Great Lakes Regional Center.
29). "What is the history of Enbridge, the company that runs Line 5?", n.d., anon, RetireLine5.org, at < https://retireline5.org/learn >, and “Sources: Ship anchor dented Line 5, caused leak”, Apr 12, 2018, updated Apr 13, Leonard N. Fleming, Beth LeBlanc, and Melissa Nann Burke, The Detroit News, at < https://www.detroitnews.com/story/news/politics/2018/04/12/harsh-weather-inspection-straits-damage/33772249/ >: “Pipelines”, “Line 5”, n.d., anon., Sierra Club Michigan Chapter, at < https://www.sierraclub.org/michigan/pipelines >: “10 years later, Kalamazoo River spill still colors Enbridge pipeline debate”, Jul 24, 2020, Kelly House, Bridge Michigan, at < https://www.bridgemi.com/michigan-environment-watch/10-years-later-kalamazoo-river-spill-still-colors-enbridge-pipeline >: “Sunken Hazard: Aging oil pipelines beneath the Straits of Mackinac an ever-present threat to the Great Lakes”, Oct 08, 2012, Jeff Alexander, & Beth Wallace, link to download pdf at site, National Wildlife Federation, at < https://www.nwf.org/Educational-Resources/Reports/2012/10-08-2012-Sunken-Hazard >.
30). “The Problem”, “Overview”, Oil and Water Don’t Mix, at < https://www.oilandwaterdontmix.org/problem >
31). “Line 5 in the Straits of Mackinac”, n.d., anon., For Love of Water (FLOW), at < https://forloveofwater.org/line5/ >.
32). “Line 5 in the Straits of Mackinac”, n.d., anon., “What is the Oil Tunnel?”, For Love of Water (FLOW), at < https://forloveofwater.org/line5/ >: “Is the Line 5 tunnel a bridge to Michigan’s energy future or a bad deal?”, April 1, 2021, Kelly House & Lester Graham, Bridge Michigan, at < https://www.greatlakesnow.org/2021/04/enbridge-line-5-tunnel-michigan-energy-future-or-bad-deal/ >
33). "What is the history of Enbridge, the company that runs Line 5?", Retire Line 5, at < https://retireline5.org/learn >: “10 years later, Kalamazoo River spill still colors Enbridge pipeline debate”, Jul 24, 2020, Kelly House, Bridge Michigan, at < https://www.bridgemi.com/michigan-environment-watch/10-years-later-kalamazoo-river-spill-still-colors-enbridge-pipeline >: and “The Dilbit Disaster: Inside The Biggest Oil Spill You’ve Never Heard Of, Part 1”, Jun 26, 2012, Elizabeth McGowan & Lisa Song, InsideClimate News, at < https://insideclimatenews.org/news/26062012/dilbit-diluted-bitumen-enbridge-kalamazoo-river-marshall-michigan-oil-spill-6b-pipeline-epa/ >.
34). “The Dilbit Disaster: Inside The Biggest Oil Spill You’ve Never Heard Of, Part 1”, Jun 26, 2012, Elizabeth McGowan & Lisa Song, InsideClimate News, at < https://insideclimatenews.org/news/26062012/dilbit-diluted-bitumen-enbridge-kalamazoo-river-marshall-michigan-oil-spill-6b-pipeline-epa/ >.
35). “The Dilbit Disaster: Inside The Biggest Oil Spill You’ve Never Heard Of, Part 2”, Jun 27, 2012, InsideClimate News, at < https://insideclimatenews.org/news/27062012/dilbit-kalamazoo-marshall-oil-spill-bitumen-enbridge-patrick-daniel-6b-pipeline-epa-tar-sands/ >: and “Michigan Oil Spill: Enbridge Energy Partners CEO Patrick Daniel Speaks Part 2”, interview WKZO News, from 0.46 - 1:42, at < https://www.youtube.com/watch?v=NltlLUzLNxc >.
36). “Kalamazoo River Disaster”, n.d., anon., Sierra Club Michigan Chapter, at < https://www.sierraclub.org/michigan/kalamazoo-river-disaster >: “Pipelines”, “Enbridge and the Kalamazoo River Disaster”, n.d., anon., Sierra Club Michigan Chapter, at < https://www.sierraclub.org/michigan/pipelines >: “The Dilbit Disaster: Inside The Biggest Oil Spill You’ve Never Heard Of, Part 1”, Jun 26, 2012, Elizabeth McGowan & Lisa Song, InsideClimate News, at < https://insideclimatenews.org/news/26062012/dilbit-diluted-bitumen-enbridge-kalamazoo-river-marshall-michigan-oil-spill-6b-pipeline-epa/ >: Part 2, Jun 27, 2012, InsideClimate News, at < https://insideclimatenews.org/news/27062012/dilbit-kalamazoo-marshall-oil-spill-bitumen-enbridge-patrick-daniel-6b-pipeline-epa-tar-sands/ >: Part 3, Jun 28, 2012, InsideClimate News, at < https://insideclimatenews.org/news/28062012/dilbit-disaster-diluted-bitumen-oil-spill-enbridge-6b-michigan-epa-kalamazoo-river/ >: “A Dilbit Primer: How It’s Different from Conventional Oil”, Nov 2, 2011, Marie C. Baca, InsideClimate News, at < https://insideclimatenews.org/news/02112011/keystone-xl-oil-sands-pipeline-diluted-bitumen-dilbit-secret-chemicals-corrosion-spill-enbridge/ >.
37). “The Dilbit Disaster: Inside The Biggest Oil Spill You’ve Never Heard Of, Part 1”, Jun 26, 2012, Elizabeth McGowan & Lisa Song, InsideClimate News, at < https://insideclimatenews.org/news/26062012/dilbit-diluted-bitumen-enbridge-kalamazoo-river-marshall-michigan-oil-spill-6b-pipeline-epa/ >: Enbridge Pipeline Spill in Marshall, Michigan, Hearing: Committee on Transportation and Infrastructure, House of Representatives, Sep 15, 2010, pp. 12 & 13, {pp 16 & 17 per pdf pagination} at < https://www.documentcloud.org/documents/351569-enbridge-cong-test.html#document/p16/a61035 >.
38). “The Dilbit Disaster: Inside The Biggest Oil Spill You’ve Never Heard Of, Part 1”, Jun 26, 2012, Elizabeth McGowan & Lisa Song, InsideClimate News, at < 5https://insideclimatenews.org/news/26062012/dilbit-diluted-bitumen-enbridge-kalamazoo-river-marshall-michigan-oil-spill-6b-pipeline-epa/ >: Enbridge Pipeline Spill in Marshall, Michigan, Hearing: Committee on Transportation and Infrastructure, House of Representatives, Sep 15, 2010, pg. 14, {pg 18 per pdf pagination} at < https://www.documentcloud.org/documents/351569-enbridge-cong-test.html#document/p16/a61035 >.
39). “The Dilbit Disaster: Inside The Biggest Oil Spill You’ve Never Heard Of, Part 1”, Jun 26, 2012, Elizabeth McGowan & Lisa Song, InsideClimate News, at < 5https://insideclimatenews.org/news/26062012/dilbit-diluted-bitumen-enbridge-kalamazoo-river-marshall-michigan-oil-spill-6b-pipeline-epa/ >: “An Enbridge Oil Spill on My Grandparents’ Farm”, “The tainted legacy of Line 6B's spill in the Kalamazoo River watershed 10 years ago”, Jul 24, 2020, Frank D. Zinn, For Love of Water (FLOW), at < https://forloveofwater.org/an-enbridge-oil-spill-on-my-grandfathers-farm/ >: “THE SAFETY OF HAZARDOUS: LIQUID PIPELINES (PART 2): INTEGRITY MANAGEMENT”, HEARING BEFORE THE SUBCOMMITTEE ON RAILROADS, PIPELINES, AND HAZARDOUS MATERIALS, July 15, 2010, at < https://www.govinfo.gov/content/pkg/CHRG-111hhrg57487/html/CHRG-111hhrg57487.htm >
40). “Enbridge Emergency Response Plan: Superior Region”, pg 7 {pg 5 in pdf pagination} at < https://www.documentcloud.org/documents/372383-part-3-enbridge-response-plans-chicago-superior.html#document/p5/a61085 >.
41). “Enbridge Spills”, “Say NO to Enbridge Pipeline Expansion”, 80 Feet Is Enough!, at < https://80feetisenough.org/index.php?page=enbridge-spills >
42). “Dangerous Pipelines: Enbridge's History of Spills Threatens Minnesota Waters”, Nov 14, 2018, anon., Map in “PHMSA Data on Enbridge Pipeline Spills”, Greenpeace, at < https://www.greenpeace.org/usa/reports/dangerous-pipelines/#enbridge-history >
43). The Kalamazoo River Spill: Pipelines, Politics, and Economies of Knowledge, 2014, Sonia Grant, pp. 71 & 72 {pp 79 & 80 in pdf pagination}, Master’s Thesis, Department of Geography & Program in Planning, University of Toronto.
44). “Oil Sands Mining Uses Up Almost as Much Energy as It Produces”, Feb 19, 2013, Rachel Nuwer, Inside Climate News, at < https://insideclimatenews.org/news/19022013/oil-sands-mining-tar-sands-alberta-canada-energy-return-on-investment-eroi-natural-gas-in-situ-dilbit-bitumen/ >.
45). “Environmental consequences of oil production from oil sands”, Dec 16, 2016, Lorenzo Rosa, Kyle F. Davis, Maria C. Rulli, & Paolo D'Odorico, Earth’s Future, AGU Publications, Research Article, at < https://agupubs.onlinelibrary.wiley.com/doi/epdf/10.1002/2016EF000484 >.
46). “Land and Water Impacts of Oil Sands Production in Alberta”, Feb 24, 2012, Sarah M. Jordaan, Environmental Science and Technology, V46(7), pp. 3611–3617, at < https://pubs.acs.org/doi/10.1021/es203682m >.
47). “Land and Water Impacts of Oil Sands Production in Alberta”, Feb 24, 2012, Sarah M. Jordaan, Environmental Science and Technology, V46(7), pp. 3611–3617, at < https://pubs.acs.org/doi/10.1021/es203682m >.
48). “10 Threats from the Canadian Tar Sands Industry”, Aug 13, 2015, Nicole Greenfield, National Resources Defense Council, at < https://www.nrdc.org/stories/10-threats-canadian-tar-sands-industry >.
49). “Report: Alberta’s Tailings Ponds”, n.d., anon., Environmental Defence, the website includes two live meters that record the ever growing volume of contaminated water in the Tailings Ponds and the ever growing public financial liability for its clean-up, at < https://environmentaldefence.ca/report/albertas-tailings-ponds/ >: One trillion litres of toxic waste and growing: Alberta’s tailings ponds, Report prepared by Environmental Defence and the Natural Resources Defense Council (NRDC), the website cited above has a link to download the report.
50). “Happy Anniversary: The largest inland oil spill in U.S. history happened in Minnesota”, April 11, 2021, original publication date Mar 3, 2017 , Winona Laduke Executive Director, Honor the Earth, Grand Rapids MN Herald Review, at < https://www.grandrapidsmn.com/opinion/happy-anniversary-the-largest-inland-oil-spill-in-u-s-history-happened-in-minnesota/article_2ade2706-004f-11e7-9023-2b31a01741a6.html >.
51). "The Problem", Oil and Water Don't Mix, at < https://www.oilandwaterdontmix.org/problem >.
52). “North American Oil Pipeline Projects Push On, Despite Market Crunch”, Jun 11, 2020, Scott Van Voorhis & Debra K. Rubin, Engineering News Record, at < https://www.enr.com/articles/49530-north-american-oil-pipeline-projects-push-on-despite-market-crunch >.
53). "Hugo Chavez Told Me He Won't Sell Oil to the Kochs", Feb 8, 2013, Greg Palast, Vice, at < https://www.vice.com/en/article/7be3ex/koch-brothers-hugo-chavez-and-the-xl-pipeline>.
54). "Keystone XL Oil Pipeline", "Background", Global Energy Monitor Wiki, at < https://www.gem.wiki/Keystone_XL_Oil_Pipeline >.
55). “Line 3 Replacement Program (Canada)”, at < https://www.enbridge.com/projects-and-infrastructure/projects/line-3-replacement-program-canada >.
56). “Line 9 History”, n.d., Emily Ferguson, Line 9 Communities, at < https://line9communities.com/line-9-history/ >: “Reflections on Line 9”, 2014, Emily Ferguson, Line 9 Communities, at < https://line9communities.com/reflections-on-line-9/ >: “Line 9: Journey along the pipeline”, Feb 17, 2014, Jessica McDiarmid, Toronto Star, at < https://projects.thestar.com/projects/pipeline_journey.html >.
57). “Enbridge Pipelines Inc. - Line 9B Reversal and Line 9 Capacity Expansion Project - Frequently Asked Questions - Reasons for Decision”, National Energy Board, Canada Energy Regulator, at <https://www.cer-rec.gc.ca/en/applications-hearings/view-applications-projects/line-9b-reversal/enbridge-pipelines-inc-line-9b-reversal-line-9-capacity-expansion-project-frequently-asked-questions-reasons-decision.html >: and “Enbridge Pipelines Inc. ‐ Line 9B Reversal and Line 9 Capacity Expansion Project”, Frequently Asked Questions, National Energy Board, Calgary, Alberta, Canada).
58). “Line 9B Reversal and Line 9 Capacity Expansion Project”, Enbridge, at < https://www.enbridge.com/ECRAI.aspx >.
No comments:
Post a Comment