“Congress, Biden boost war spending at the expense of social programs”, Dec 22, 2022, Patrick Martin, World Socialist Web Site, at < https://www.wsws.org/en/articles/2022/12/23/vxoy-d23.html >
“Which States Are Givers and Which Are Takers? (And is that even the correct way to frame the question?)”, May 5, 2014 - Updated on March 8, 2017. John Tierney, The Atlantic, at <https://www.theatlantic.com/business/archive/2014/05/which-states-are-givers-and-which-are-takers/361668/ >
Introduction and The Class Struggle level of Analysis by dmorista:
The Congressional Democrats and pundits and analysts noted that it was essential to pass some sort of budget, essentially one that was pretty much a copy of the budget used to run the U.S. Federal Government over the past year. The people who propounded this theory noted that a Republican controlled House of Representatives would hold the Democratic President, and the nominally Democratically Controlled Senate, hostage to demands for drastic cuts to social programs, and new attacks on Medicare and Social Security. They were undoubtedly right about this so the Democrats, with a bit of support from sane Republicans, managed to pass a $1.7 Trillion budget that is not as bad as what would have emerged after the Republican takeover of the House in a few days. However it is a pretty bad budget and was analyzed in the first article posted here.
Patrick Martin, in his article, “Congress, Biden boost war spending at the expense of social programs”, has done a fine job of pointing out the reality of the maneuvers by the Democrats, the somewhat less odious of the two political parties, that to some degree govern the United States. In the article he noted that: “Since the US inflation rate is 7 percent, the 6 percent rise in domestic spending is a real-terms cut, meaning fewer real resources for health care, education, housing, mass transportation and what remains of social benefit programs like food stamps and home heating assistance.
“By contrast, the budget raises military spending by 10 percent, to a record $858 billion. There is an additional $45 billion in aid to Ukraine, which combines financial support to the bankrupt regime in Kiev and direct military support. Total war spending is thus well over $900 billion. An increase next year of similar proportions would put the military budget above $1 trillion for the first time, a truly staggering sum. ….
“McConnell gloated (that) …. 'This an impressive outcome for the Republican negotiators,' he noted, pointing to the 'substantial, real-dollar increase' for the military, and the 'substantial real-dollar cut' in non-military spending. ….
“So fervent is the Democratic embrace of the proxy war against Russia — demonstrated in the rapturous reception for President Volodymyr Zelensky in his address to a joint session of Congress Wednesday night—that the fascistic right wing of the Republican Party has been able to posture as the only antiwar faction in official politics. (Emphasis Added)
“Much of what is classified as domestic spending is not for social needs like health, education and transportation, but for surveillance and repression, or operations in support of the military and US foreign policy. (Emphasis Added) ….
“There are also sizeable sums that go directly into the coffers of major corporations and banks, including funds for the departments of Agriculture, Commerce, Energy and Treasury. …. Boeing, for example, was reprieved from meeting a December 27 deadline to meet enhanced safety requirements on new models of its 737 MAX jets. The original model was grounded because of two disastrous crashes that killed 346 people.
“The proportion of the budget devoted to activities which could conceivably benefit working people is well under 20 percent. (Emphasis Added) ….
“As the only legislative vehicle assured of escaping a Republican filibuster, the omnibus bill included not only the appropriations for every federal department and agency through September 30, 2023, but many other bills on issues entirely unrelated to the financing of the federal government.
“Many more such provisions will be uncovered and made public as journalists and others investigate the 4,155 pages of the omnibus bill.”
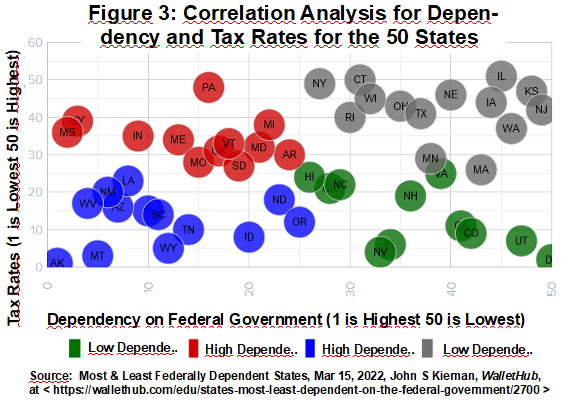
Another major question that arises in these sorts of discussions is the different manner in which states are taxed and the transfer of Federal Funds from the most liberal and, dare we say the most civilized states, to the more primitive and vicious places. This was discussed to a significant degree in an article in The Atlantic, “Which States Are Givers and Which Are Takers? …”, back in 2014. Tierney relies on analysis from WalletHub where he writes that WalletHub's analysis noted that: “There has been a long-term transfer of Federal expenditures to places like Arizona, Mississippi, Kentucky, Wyoming and Montana for decades now. They compared the 50 states and the District of Columbia on three metrics: (1) federal spending per capita compared with every dollar paid in federal income taxes; (2) the percentage of a state’s annual revenue that comes from federal funding; and (3) the number of federal employees per capita. The third measure received only half the weight of each of the others in the calculation.”
Tierney, harkening back to the New Deal Coalition and how FDR, and the Progressive Democrats, pushed by an organized working class that could close down huge areas of capital intensive industries, and that was led by 3 leftist parties, the Socialists, the Socialist Labor, and the Communist Parties, also notes that: “Part of the explanation for why southern states dominate the “most dependent” category is historical. During the many decades in the 20th century when the South was solidly Democratic, its congressional representatives in both the House and the Senate, enjoying great seniority, came to hold leadership positions on powerful committees, which they used to send federal dollars back to their home states in the form of contracts, projects, and installations.
“Another part of the explanation is easier to discern. The reddest states on that map at the top—Mississippi, Alabama, Louisiana, New Mexico, Maine—have exceptionally high poverty rates and thus receive disproportionately large shares of federal dollars. Through a variety of social programs, the federal government disburses hundreds of billions of dollars each year to maintain a 'safety net' intended to help the neediest among us.” (See, “Most & Least Federally Dependent States”, Mar 15, 2022, John S Kiernan, WalletHub, at <https://wallethub.com/edu/states-most-least-dependent-on-the-federal-government/2700>)
Tierney cites a Business Insider article that noted that: “Who really benefits from government spending? If you listen to Rush Limbaugh, you might think it was those blue states, packed with damn hippie socialist liberals, sipping their lattes and providing free abortions for bored, horny teenagers. ...
“As it turns out, it is red states that are overwhelmingly the Welfare Queen States. Yes, that's right. Red States—the ones governed by folks who think government is too big and spending needs to be cut—are a net drain on the economy, taking in more federal spending than they pay out in federal taxes. They talk a good game, but stick Blue States with the bill.” (Emphasis added)
The same Business Insider article points out that of the 20 states, with the highest ratio of Federal Monies sent to the states versus Federal Taxes Paid, 16 are Republican Dominated Red States. This includes an “ …. overwhelming presence of northern 'rugged individualist' states, like Alaska, the Dakotas and Montana, along with most of the South ….”
(See, “Red States Are Welfare Queens”, Aug 18, 2011, Benzinga, Business Insider, at <https://www.businessinsider.com/red-states-are-welfare-queens-2011-8#!IpqnG >)
The resultant situation is shown graphically in the 2 maps and the Correlation Analysis posted here below. Figure 1 is a somewhat more detailed version of the national situation I found at the Tax Foundation's website, Figure 2 is the original WalletHub map. And Figure 3 is a graphic of the Correlation Analysis from WalletHub:


XXXXXXXXXXXXXXXXXXXXXXXXXXXXXXXXXXXXXXXXX
“Congress, Biden boost war spending at the expense of social programs”, Dec 22, 2022, Patrick Martin, World Socialist Web Site, at < https://www.wsws.org/en/articles/2022/12/23/vxoy-d23.html >
The massive omnibus budget bill passed by Congress and endorsed by President Joe Biden will cut social spending in real terms while increasing military spending and providing a further gusher of funds for the US proxy war in Ukraine against Russia.
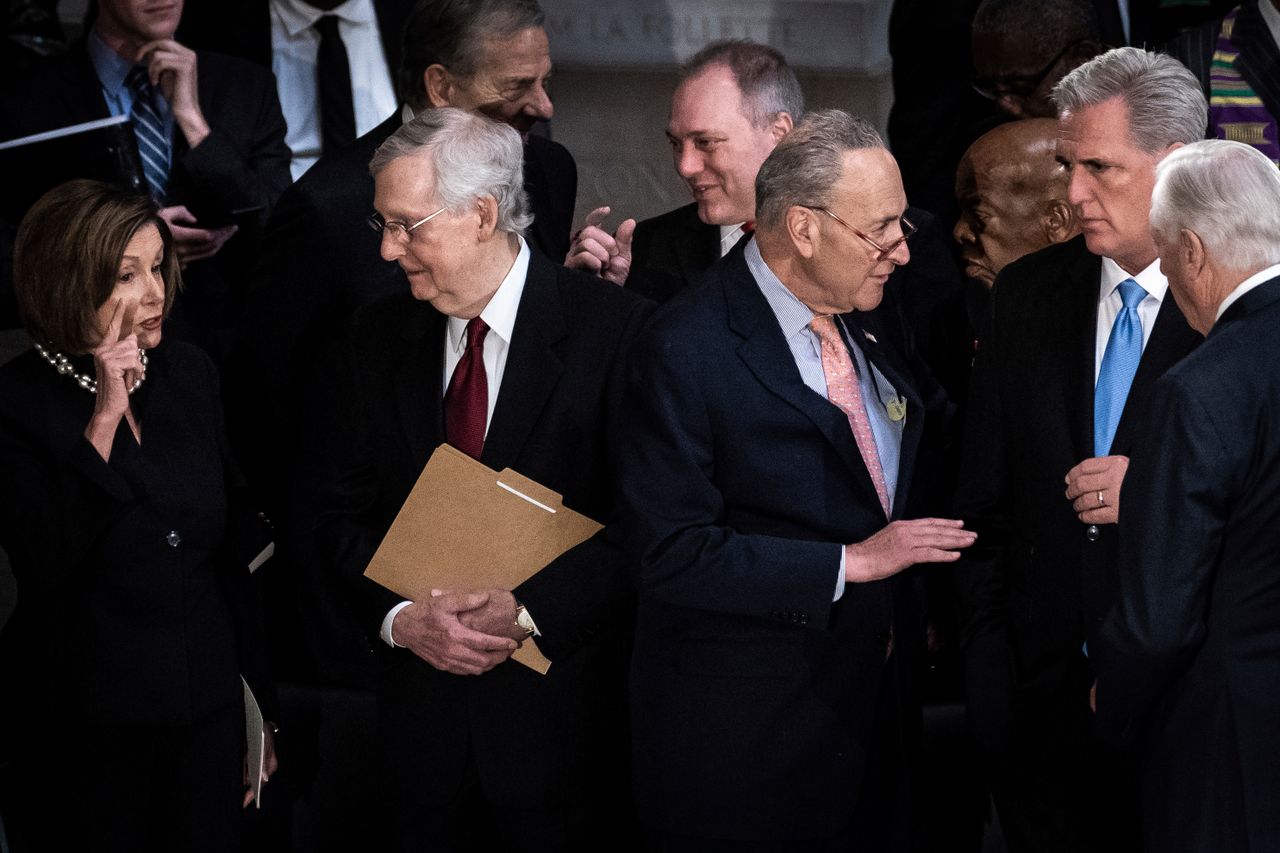
House Speaker Nancy Pelosi (D-CA) talks with Senate Republican Leader Mitch McConnell (R-KY) as Senate Democratic Leader Chuck Schumer (D-NY) talks with House Minority Leader Kevin McCarthy (R-CA) and House Majority Leader Steny Hoyer (D-MD) (Erin Schaff/Pool via AP) [AP Photo]
The omnibus legislation passed the Senate Thursday afternoon by a 68–29 vote, with all 50 Democrats and 18 Republicans supporting it, and 29 Republicans opposed. The bill raises domestic spending by $42 billion, or 6 percent, and raises military spending by $76 billion, roughly 10 percent.
The legislation accounts only for discretionary federal spending, which is subject to congressional action each year. An even larger sum goes to automatic outlays, so-called entitlements, which include Social Security and Medicare payments, other small retirement and benefit plans, and interest on the federal debt, which will rise sharply next year as the Federal Reserve raises rates.
Besides the top-line numbers of $858 billion for the military and $772 billion for domestic programs, there is another $80 billion in emergency spending, more than half for Ukraine, and the remainder to fund responses to US natural disasters like hurricanes, floods and wildfires. The White House proposal of $9 billion to fund future responses to the ongoing coronavirus pandemic was dropped.
Since the US inflation rate is 7 percent, the 6 percent rise in domestic spending is a real-terms cut, meaning fewer real resources for health care, education, housing, mass transportation and what remains of social benefit programs like food stamps and home heating assistance.
By contrast, the budget raises military spending by 10 percent, to a record $858 billion. There is an additional $45 billion in aid to Ukraine, which combines financial support to the bankrupt regime in Kiev and direct military support. Total war spending is thus well over $900 billion. An increase next year of similar proportions would put the military budget above $1 trillion for the first time, a truly staggering sum.
The bipartisan budget deal between Senate Democratic leader Charles Schumer and Republican leader Mitch McConnell established for the first time that domestic spending would increase at a significantly lower rate than military spending.
McConnell gloated after the terms were made public early Tuesday morning, citing the much larger rise in military spending in comparison to domestic spending. “This an impressive outcome for the Republican negotiators,” he noted, pointing to the “substantial, real-dollar increase” for the military, and the “substantial real-dollar cut” in non-military spending.
The top Republican on the Armed Service Committee, Senator Jim Inhofe of Oklahoma, said, “While this is not the package Republicans would have written on our own,” the allocation to the Pentagon “gives our military the resources needed to take on China, Russia and other looming threats.”
Senator Bernie Sanders lamented, “The defense spending is outrageous—much too high. But at the end of the day, I don’t want to see the government shut down, and there are some very important provisions in it.”
It was not a matter, however, of the Democrats caving in to Republican threats to block the passage of the omnibus and force a partial government shutdown. In reality, the Democrats enthusiastically embraced the huge military increase, and no longer advocate even nominal parity between domestic and military spending.
With the war in Ukraine, the Democratic Party has openly emerged as a party of rabid militarism. So fervent is the Democratic embrace of the proxy war against Russia—demonstrated in the rapturous reception for President Volodymyr Zelensky in his address to a joint session of Congress Wednesday night—that the fascistic right wing of the Republican Party has been able to posture as the only antiwar faction in official politics.
The Pentagon funding includes a 4.6 percent pay raise for uniformed military personnel, and increases in virtually every area of procurement of new weapons systems, for the Army, Navy, Air Force and Marines, including 19 new warships and 69 new F-35 fighter jets (average cost $80 million). The Department of Defense will also spend the largest-ever amount on research and development, $140 billion, to devise and produce new weapons systems.
Much of what is classified as domestic spending is not for social needs like health, education and transportation, but for surveillance and repression, or operations in support of the military and US foreign policy. This includes $61 billion for the Department of Homeland Security (up 5 percent), $152 billion for “Military Construction and Veteran’s Affairs,” up a whopping 20 percent, $60 billion for the State Department (up 6 percent), and $39 billion for the Department of Justice, which includes the FBI and other federal police operations.
There are also sizeable sums that go directly into the coffers of major corporations and banks, including funds for the departments of Agriculture, Commerce, Energy and Treasury.
The proportion of the budget devoted to activities which could conceivably benefit working people is well under 20 percent.
Even this spending is largely offset by provisions that will lead to further reductions in social benefits. The omnibus legislation allows states to begin kicking people off Medicaid, the joint federal-state health insurance for the poor, as early as next April, when states can begin reviewing eligibility of recipients.
Eligibility has been frozen since the onset of the COVID-19 pandemic, but Republican-run state governments have been demanding the restoration of their power to exclude recipients from benefits, based on more draconian eligibility requirements or direct funding cuts.
Despite much rhetoric to the contrary, from Sanders and others, the Democratic negotiators dropped a proposal to restore the child tax credit to the levels which prevailed in 2020–2021 as part of pandemic relief. This expired in January 2022, and will not be revived because of opposition by Republicans and some right-wing Democrats, such as Joe Manchin of West Virginia.
The bill would expand contributions to 401(k) plans (private retirement funds), by requiring most employers to enroll employees automatically and providing a 50 percent federal match for the first $2,000 in contributions. This will have the effect of directing even more of workers’ earnings into the Wall Street casino, providing a new source of funding for the financial markets.
As the only legislative vehicle assured of escaping a Republican filibuster, the omnibus bill included not only the appropriations for every federal department and agency through September 30, 2023, but many other bills on issues entirely unrelated to the financing of the federal government.
The most important was a revision of the 1887 Electoral Act, the law regulating the certification of electoral votes cast in a presidential election, which was distorted by lawyers for Donald Trump to provide a legal cover for overturning his 2020 defeat.
The bill states explicitly that the vice president has only a ceremonial role in the congressional certification of electoral votes, and may not interfere by rejecting the electoral votes of any state. It also raises the number of legislators required to force a vote on certifying a state’s electors from one senator and one member of the House of Representatives to one-fifth of the members of each chamber. It also specifies that only one slate of electors, certified by the governor, shall be submitted from each state.
In an expression of the anti-China frenzy in Washington, another provision bans the Chinese-made TikTok application from all government cellphones, laptops and other electronic devices.
There are countless other special provisions inserted by senators and congressmen in response to appeals from corporate lobbyists, lubricated by lavish campaign contributions. These are small only in comparison to the $1.7 trillion total, but highly valuable to the corporate interests that promoted them.
Boeing, for example, was reprieved from meeting a December 27 deadline to meet enhanced safety requirements on new models of its 737 MAX jets. The original model was grounded because of two disastrous crashes that killed 346 people.
Many more such provisions will be uncovered and made public as journalists and others investigate the 4,155 pages of the omnibus bill.
XXXXXXXXXXXXXXXXXXXXXXXXXXXXXXXXXXXXXXXXXXXXXXXXX
Which States Are Givers and Which Are Takers? (And is that even the correct way to frame the question?), May 5, 2014 - Updated on March 8, 2017. John Tierney, The Atlantic, at <https://www.theatlantic.com/business/archive/2014/05/which-states-are-givers-and-which-are-takers/361668/ >
Maps showing regional differences among Americans are all the rage these days, such as this depiction of the contours of baseball fandom, or this one of the beers we're alleged to favor, or this showing the places in America where none of us lives, or this creative video/map showing where Americans use different words for common things such as soda.
For my money, one of the more interesting maps appearing recently came from the personal-finance website WalletHub. Analysts there set out to determine how states compare in terms of their reliance on federal funding.
The WalletHub analysts essentially asked how much each state receives back as a return on its federal income-tax investment. They compared the 50 states and the District of Columbia on three metrics: (1) federal spending per capita compared with every dollar paid in federal income taxes; (2) the percentage of a state’s annual revenue that comes from federal funding; and (3) the number of federal employees per capita. The third measure received only half the weight of each of the others in the calculation.
What the resulting map shows is that the most “dependent states,” as measured by the composite score, are Mississippi and New Mexico, each of which gets back about $3 in federal spending for every dollar they send to the federal treasury in taxes. Alabama and Louisiana are close behind.
If you look only at the first measure—how much the federal government spends per person in each state compared with the amount its citizens pay in federal income taxes—other states stand out, particularly South Carolina: The Palmetto State receives $7.87 back from Washington for every $1 its citizens pay in federal tax. This bar chart, made from WalletHub’s data, reveals the sharp discrepancies among states on that measure.

On the other side of this group, folks in 14 states, including Delaware, Minnesota, Illinois, Nebraska, and Ohio, get back less than $1 for each $1 they spend in taxes.
It’s not just that some states are getting way more in return for their federal tax dollars, but the disproportionate amount of federal aid that some states receive allows them to keep their own taxes artificially low. That’s the argument WalletHub analysts make in their 2014 report on best and worst states to be a taxpayer.
Part of the explanation for why southern states dominate the “most dependent” category is historical. During the many decades in the 20th century when the South was solidly Democratic, its congressional representatives in both the House and the Senate, enjoying great seniority, came to hold leadership positions on powerful committees, which they used to send federal dollars back to their home states in the form of contracts, projects, and installations.
Another part of the explanation is easier to discern. The reddest states on that map at the top—Mississippi, Alabama, Louisiana, New Mexico, Maine—have exceptionally high poverty rates and thus receive disproportionately large shares of federal dollars. Through a variety of social programs, the federal government disburses hundreds of billions of dollars each year to maintain a “safety net” intended to help the neediest among us. Consider, for example, the percentage of each state’s residents who get food stamps through the federal government’s SNAP program. This chart tells the story.
Number of People in State on Food Stamps (April 2014) / Population of State (2010)

Another way of getting at the same point is to map the percentage of families in 2012 with incomes below the federal poverty level (according to the Census Bureau’s ACS five-year estimate). This map, made through Social Explorer, shows the data at the county level: The darker the shading, the higher the percentage of impoverished residents.

You can go here to see an interactive version of this map that enables you to scroll your cursor over counties and get pop-up information showing the percentages for any specific county. You can also change the map view, showing the data at different levels, ranging from states all the way down to individual census block groups. (To see the mapped data at sub-county levels, you have to zoom way in to particular areas.)
There are various ways of thinking about what WalletHub’s “state dependency” map tells us. One approach is to shine light on the red-states-as-takers paradox: Dominated by Republican voters who profess their distaste for the federal government and its social programs, these are the very states that rank highest on the dependency index. That, for example, is how Business Insider handled the story:
Who really benefits from government spending? If you listen to Rush Limbaugh, you might think it was those blue states, packed with damn hippie socialist liberals, sipping their lattes and providing free abortions for bored, horny teenagers. ...
As it turns out, it is red states that are overwhelmingly the Welfare Queen States. Yes, that's right. Red States—the ones governed by folks who think government is too big and spending needs to be cut—are a net drain on the economy, taking in more federal spending than they pay out in federal taxes. They talk a good game, but stick Blue States with the bill.
Fair enough. That’s a catchy perspective. And there are few things more fun than exposing hypocrisy.
Alternatively, we could use the “state dependency” map as an opportunity to reflect on a different paradox—the long-standing role of the far-away federal government as an agent of community. Because of federal programs, people in places like South Carolina and Mississippi are getting a helping hand not from their neighbors a few blocks away or in the next county over, but from residents of Delaware, Minnesota, Illinois, and Nebraska. Whether you like that idea depends, in part, on how you personally reconcile the tension between two long-cherished, core American values—our passion for individualism and our regard for community—and whether you see “community” as encompassing the whole country.
That's a far more interesting thing to think about (though perhaps less viscerally satisfying) than which states are moochers or freeloaders and which are getting fleeced.
John Tierney is a contributing writer for The Atlantic and a former professor of American government at Boston College. He is the author of Organized Interests and American Democracy (with Kay L. Schlozman) and The U.S. Postal Service: Status and Prospects of a Government Enterprise.
No comments:
Post a Comment