1). “US can't compete with China's technology, so it wages economic war”, Mar 5, 2024, Ben Norton, Geopolitical Economy Report, duration of video 44:22 at < https://www.youtube.com/watch?
2). “Richard Wolff on the decline of the US empire and the rise of China and BRICS”, Dec 20, 2023, Richard Wolff speaks, The Community Church of Boston, duration of video 56:22, at < https://www.youtube.com/watch?
3). “Inside the World's Biggest Container Ship Ever Built”, Feb 20, 2024, Anon, Beyond Facts, duration of video 10:13, at < https://www.youtube.com/watch?
4). “Yangshan: How China Built A Mega-Port 30km Out At Sea | Megastructures”, Feb 21, 2024, Anon, Spark, duration of video 50:42, at < https://www.youtube.com/watch?
~~ recommended by dmorista ~~
Introduction by dmorista: These 4 videos look at different aspects of the rise of China, and to a lesser degree the rise of The BRICS societies, to global prominence and leadership in Capitalism. In Item 1)., “US can't compete with China's technology ...”, Ben Norton points out that China now leads the world in the production and deployment of Solar Panels and Wind Turbines. In the last year, 2023, China produced and placed into use more Solar and Wind energy than the rest of the world. China burnt a lot of coal, oil, and natural gas to build its now world leading infrastructure with its many truly impressive bridges and tunnels, train systems, subways in all cities over 1 million population, laboratories and research centers, and its capability to produce solar panels and wind turbines in record numbers.
The Chinese claim they will reach a carbon neutral status by around 2030 or 2035. At this point, however, the Chinese, and much of the rest of East Asia and parts of South Asia are still emitting GHGs at a much higher rate of growth of emissions, than is the case in “The West”. This situation is reflected in Graphs 1 - 3 below.
Graph 1 shows that China has risen from only contributing a negligible portion of the GHGs in the atmosphere to being a major emitter. For instance in 1950 The U.S. had emitted a total of 39.88% of cumulative Global CO2, while the E.U. 27 had emitted 28.46%, and Europe other than the E.U. had emitted 21.45%, meanwhile only 3.5% of cumulative emissions were generated in Asia (other than China or India), China had emitted only 0.98% and India only 0.87% of Global Cumulative CO2 emissions. By 2022 the cumulative emissions stood at 24.69% for the U.S., 17.12% for E.U.-27, 14.26% Europe other than the E.U., 14.93% for Asia (other than China or India), 15.07% for China and 3.46% for India. Clearly current emissions of GHGs now, and for several years leading up to now, have been much higher for China and Asia other than China and India than is the case for the developed countries of The West.

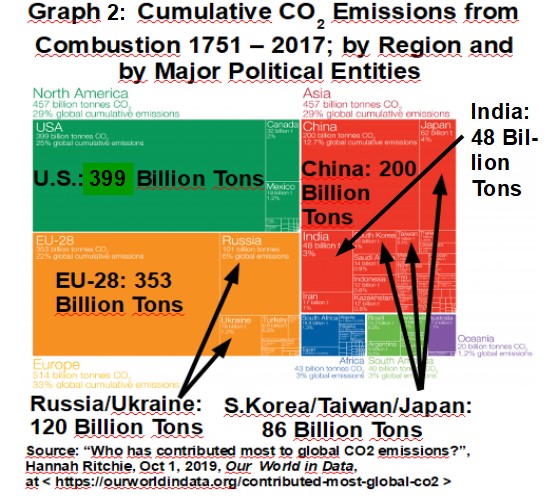
Graph 2 demonstrates that by 2017 the amount of Cumulative GHGs in the atmosphere was 399 Billion tons for the U.S., 353 Billion Tons from the E.U.-28, 86 Billion Tons from Japan, South Korea, and Taiwan, and 120 Billion Tons from Russia / Ukraine, plus 68.4 Billion Tons for Canada, Mexico, Australia. This was versus 200 Billion Tons from China and 48 Billion Tons from India. That is a total of 1026.4 Billion Tons of CO2, from the U.S., Europe, The Capitalist Asian Tigers, and Russia / Ukraine; versus 248 Billion Tons from China and India. Furthermore, some 1,274.4 Billion Cumulative Tons were emitted historically for all these “major emitters”. Total cumulative emissions of for the world at that point were 1,531 Billion Tons. Thus at that point 83.24 % of all emissions were from The Major Countries, The “West and its close allies” emitted 67.04% of all cumulative emissions while China / India had emitted 16.2% of all cumulative emissions. China had, by that point, emitted 33.39% as many GHGs as the U.S. had.
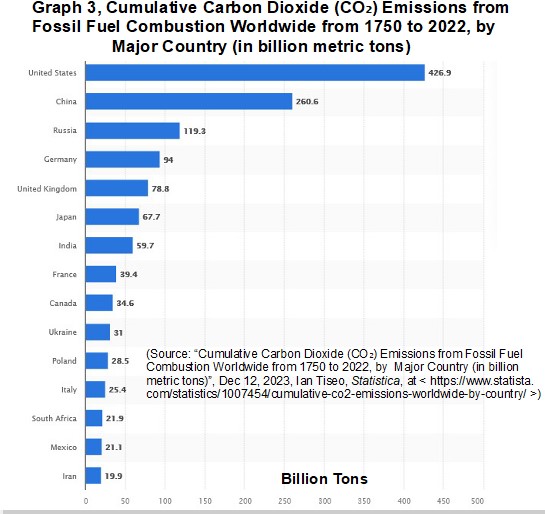
The growth of the Chinese Industrial Capacity has caused their cumulative share of CO2 emissions to rise, even as China has been very aggressive in adding renewable power sources to their society and industry. Graph 3 shows that the U.S. had, by 2022, emitted 426.9 Billion cumulative tons of CO2. Meanwhile China's total was growing faster and is now 260.6 Billion tons. China now has emitted 37.91% as many cumulative billion tons of CO2 as compared to the amount emitted by the U.S. We can expect to see the cumulative share of global GHGs due to China continue to grow, gradually, until if by 2030 or 2035 China is not emitting any net GHGs. If the U.S. does not achieve that level its cumulative GHGs will grow while those of China will begin to decrease. Some policy makers in the U.S. want to achieve a carbon-neutral status but others, of course proclaim loudly that Global Warming is “A Chinese Hoax”, and they want to “Drill Baby Drill” (their own statements in both cases).
The fact of the matter is that most of the use of resources and generation of wealth in the world now takes place in the Global South. Richard Wolff discusses this major change in how these decisions are made any who makes them in Item 2)., “Richard Wolff on the decline ….”,
This is new territory for the U.S., both for its ruling class and its general populace. Many people have not yet come to grips with this reality.
Some manifestations of this massive global change are seen in Item 3)., “Inside the World's Biggest ...”, as well as in Item 4)., “Yangshan: How China Built ...”. The articles both address the gigantic size and scale of, in this case just the ships and ports that China and other places in the Global South are building and operating, to move the products from the farms and factories of China and other powerhouses in the Global South.
During the 19th and 20th Centuries the great public works and infrastructural projects were managed and accomplished by The West. In the 21st Century this has all changed.
xxxxxxx
xxxxxxxxxxxxxxxx
xxxxxxxxxxxxxxx
No comments:
Post a Comment