1). “China is now the 'world's sole manufacturing superpower'. How did it develop so fast?”, Early Feb 2024, Ben Norton, Geopolitical Economy Report, duration of video 45:02. at < https://www.youtube.com/watch?
2). “China is the world’s sole manufacturing superpower: A line sketch of the rise”, Jan 17, 2024, Richard Baldwin, Centre for Economic Policy Research (CEPR), at < https://cepr.org/voxeu/
3). “The Travesty of 'Anti-Imperialism' ”, William I. Robinson, University of California, Santa Barbara, Summer / Fall 2023, Journal of World Systems Research, Special Issue: Immanuel Wallerstein: The Legacies, at < https://jwsr.pitt.edu/ojs/
4). “Global Capitalism: Europe 2024: Disunity, Decline, Despair [February 2024]”, Feb 14, 2024, Richard Wolff, Democracy at Work, duration of video 1:00:22 at < https://www.youtube.com/watch?
Introduction by dmorista: There are big changes afoot in the world hierarchy of powerful societies and the capitalists who, to varying degrees, dominate the countries of the world; and who pursue their own agendas moving assets and investments across all borders almost efortlessly. It comes as no surprise to anybody who has been paying attention that China is now the largest and, in many industries, the most advanced manufacturing society on Earth. Items 1)., “China is now the 'world's …. so fast?” and 2). “China is the world’s …. sketch of the rise”, discuss the rise of China's industrial power. Ben Norton in Item 1). points out the fallacy that is constantly trumpeted by the American Right that China just changed into a capitalist society and left the failings of Communism in the past. The real story is, of course, far more nuanced and complicated than that. Much of Norton's talk is based on the article from Item 2.), written by Richard Baldwin a mainstream economist.
A different interpretation of the economic rise of China is found in Item 3), “The Travesty of ….”. Robinson points out that China now has more billionaires than does the U.S.: “969 to 691” and that: “Inequality surpassed that of the United States by a large margin a decade ago and the country is now one of the most unequal in the world (Yu and Zhou 2014). Capitalism with Chinese characteristics has involved the rise of powerful Chinese transnational capitalists fused with a state-party elite dependent on the reproduction of capital and high-consumption middle strata, fueled by a devastating wave of primitive accumulation in the countryside and the exploitation of hundreds of millions of Chinese workers (see, inter-alia, Xu 2018).” He also goes on to mention that Chinese corporate interests have worked with the rulers of various Global South nations to repress their rural populations and force those people out of areas where Chinese companies wanted to install and run mines or other resource extraction operations. Robinson basically thinks that the traditional view of Leftists towards issues like Imperialism and Capitalist business operations are outdated. Just because the emerging economic powers are from the Global South, or are affiliated with the BRICS bloc, does not make them positive and non-coercive societies. The ruling classes of the Global South are just as capable as those of the Global North of making business decisions that are ruthless and exploitive of the peasants and workers of the world.
He also writes that:
“As Franz Fanon famously noted in The Wretched of the Earth (Fanon 1965), the national bourgeoisies of the former Third World were born decadent and treacherous. Far from challenging these bourgeoisies, the BRICS governments facilitate the expansion of transnational capital and the ongoing integration of 'their' national bourgeoisies into now globalized circuits of accumulation. It is therefore not just that the leading capitalist strata from the historic periphery have transnationalized across the South and the North, but in doing so, they have integrated into a global ruling class that exercises its power over the laboring masses in both South and North. The principal contradiction worldwide now is between global capital and global labor. ….
“We may support the (mildly) redistributive policies at home and dynamic foreign policy abroad of governments such as Lula’s. All capitalist states are not the same and it matters a great deal who is in the government. But a 'progressive' government is not a socialist or necessarily an anti-imperialist government.”
The most extreme example of this is, in fact, China. In the 75 years since the Chinese Revolutionary forces triumphed the population there has transformed from among the poorest on Earth to one that now has a “middle class” that amounts to more than 600 million people. As Michael Hudson and Radhika Desai point out the authoritarian states of the Global South, that produce a plethora of actual products, are now consistently implementing policies that keep housing, education, healthcare, and food relatively cheap and accessible. At the same time that the prices for these necessities of life are rapidly rising in the U.S. and its allies / dependents in Europe, societies now dominated by Finance Capital and Rentier Capital. Freedom of expression is important, and The West still tolerates much more dissent than do places like China. But the limitation in The West is that the tolerance of dissent is only operative as long as it is impotent and drowned out by the propaganda and disinformation outlets the rulers support.
Robinson also points out that:
“If the BRICS do not represent an alternative to global capitalism and the domination of transnational capital, they do signal the shift towards a more multipolar and balanced inter-statesystem within the global capitalist order.But such a multipolar inter-state system remains part of a brutal, exploitative, global capitalist world in which the BRICS capitalists and states are as much committed to control and exploitation of the global working and popular classesas are their Northern counterparts. As the BRICS membership expands, new candidates in 2023 to join the bloc include such magnificently 'autonomous and egalitarian' states fighting 'imperialist shackles' as Saudi Arabia, Egypt, Bahrain, Afghanistan, Nigeria, and Kazakhstan.
This article, by Robinson, appeared in the most recent issue of the Journal of World-Systems Research, an issue that included two other analyses of aspects of the rise of China. Indeed the rise of China to its current prominent position has been discussed and analyzed by a wide variety of authors with a wide range of ideological and political positions. Indeed it is one of the most discussed developments on Earth. (See, “Cycles and Transformation: China’s State-Capitalism as Adaptive Strategy in the Arc of Capitalist Governance”, Summer / Fall 2023, Lewis Michael Birley, Journal of World Systems Research, Special Issue: Immanuel Wallerstein: The Legacies, at < https://jwsr.pitt.edu/ojs/
In Item 4), “Global Capitalism: Europe 2024: ….”, Richard Wolff talks about the fact that Europe has now sunk, in socio-economic and political terms, to the defacto status of a colony of the U.S. The same sort of hopelessness and despair that afflicts much of the U.S. population now manifests itself among the people of much of Europe. The populations of almost all European nations are declining as female fertility rates (measured as children / woman / lifetime) drop down to less than 2, much less than 2 in many cases. Of course low female fertility is the case in all developed countries, the lowest fertility rates in the world are in Taiwan and S. Korea. Certainly both of these East Asian countries are places that are still economically dynamic. The changes in Europe are disconcerting for the populace in general and for working people in particular. In many European countries, as in the U.S., immigration from the less-developed societies of the Global South has become a dominant political issue. Wolff notes that the traditional leftist political parties of Europe have cooperated with the Capitalists who want access to cheap labor. The long-term allegiance of the native-born working people to the Socialist and Communist Parties in Europe is fraying; as fascist and reactionary politicians and parties become more powerful.
There is no doubt that the past 20 years have seen a major shuffle in where the most powerful and important centers of capitalist power are located. The 500 year period of European, and in the last instance American, dominance is ending. Also, as Robinson and others of the Trans-National Capitalism school of thought have pointed out, capitalism has become truly globalized. The simpler days when Capital was mostly national and the main socio-economic and political struggles were either in the core Capitalist Countries between their domestic workers and Capital, or confrontations in the Third World that were between the peasants and workers of Third World places and The West, are clearly over. Capital has, not too surprisingly, become adept at operating across borders. Chinese companies have become, by far, the largest builders of infrastructure be it the Belt and Road program or many other projects often aimed at accessing resources. Alliances, cooperation, and mergers of companies take place to maximize the profits and access of Capitalist companies to resources and cheap labor. A steel producing company from India has bought up much of the steel producing capacity in the countries in the former Core of Capitalism, a Brazilian magnate owns most of the beer brewing operations in the U.S., Chinese Companies build most of the world's infrastructural projects, while the U.S. handles the thuggery and swindles. And everywhere the ruling-class is promoting authoritarian and coercive forces.
xxxxxxxxxxxxxxxxx
xxxxxxxxxxxxxxx
China is the world’s sole manufacturing superpower: A line sketch of the rise
The US is the world’s sole military superpower. It spends more on its military than the ten next highest spending countries combined. China is now the world’s sole manufacturing superpower. Its production exceeds that of the nine next largest manufacturers combined. This column uses the recently released 2023 update of the OECD TiVA database to paint an eight-chart portrait of China’s journey to superpower status and the asymmetric impact that its dominance has had on global supply chains.
I'm not an expert on China, but during ongoing work on global supply chain disruptions with my co-authors Rebecca Freeman and Angelos Theodorakopoulos, I've noticed a stark fact that I don’t think is as widely known as it should be. China is the now world’s sole manufacturing superpower.
This column uses the OECD’s recently released 2023 update of their invaluable TiVA database to show, in eight charts, how this came to be. I will skip the historical Chinese reform narrative as that has been well covered by real China experts (e.g. Wang 2023, World Bank 2013, Ranganathan 2023).
The world’s big players in manufacturing
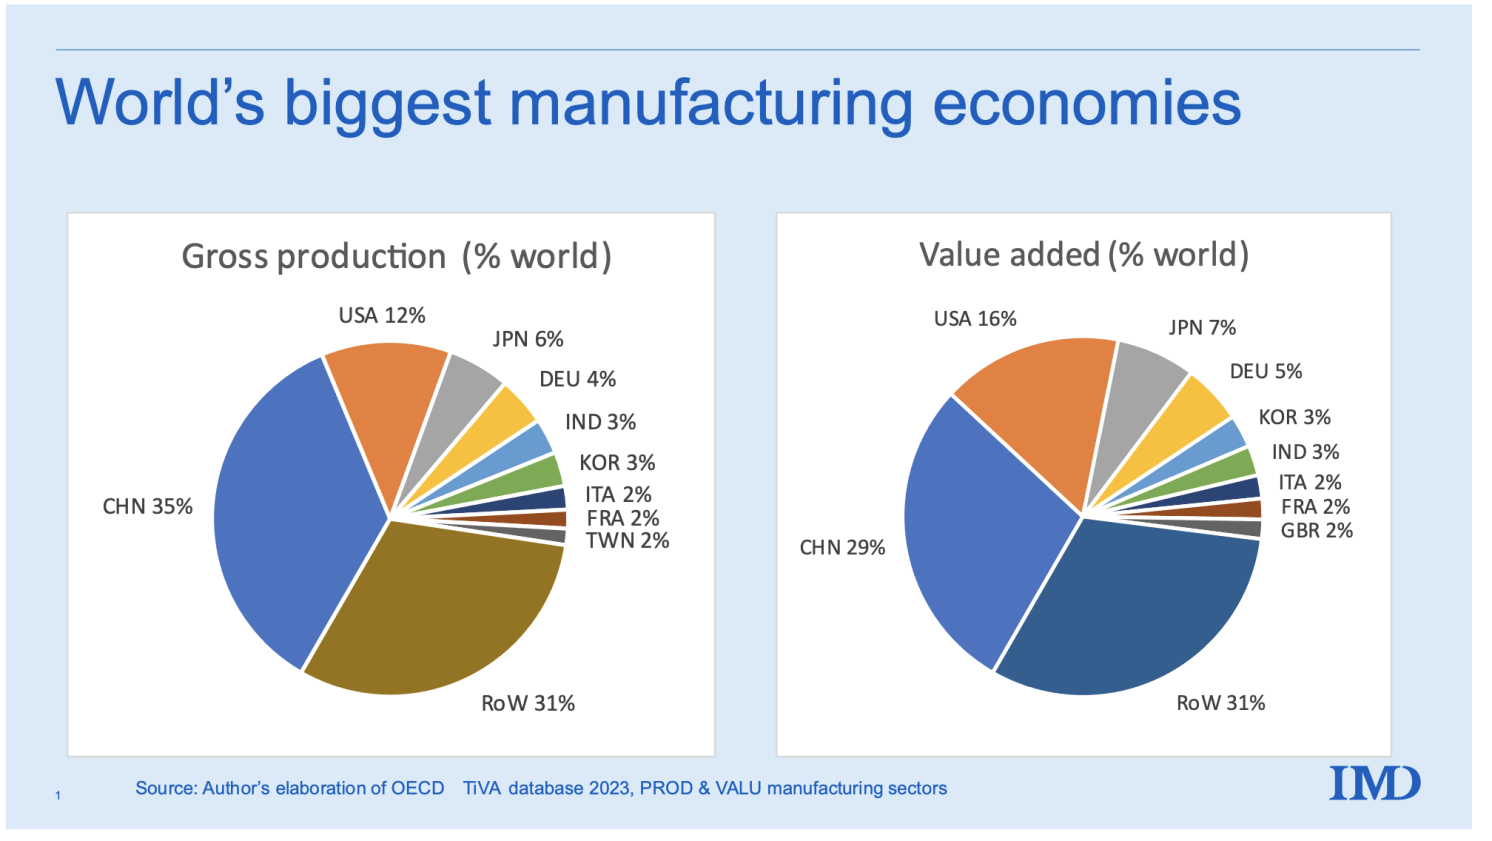
The charts in Figure 1 show two views of global manufacturing shares in 2020 (the latest year in the database). The left panel displays world shares in terms of gross production; in the right panel, the same is shown in terms of value added. The distinction is in intermediate inputs: Chinese gross production equals the total sales of Chinese manufacturers; Chinese value added is their gross production minus the purchased intermediates.
Figure 1 Slicing the global manufacturing pie, 2020, gross production basis
Source: OECD TiVA database, 2023 update.
Six nations manufacture at least 3% of the world total. China is followed by the US, Japan, Germany, India, and South Korea. Note how the world has changed. Only three of these are long-established industrial economies; the other three are newly industrialised economies. Four of the G7 don’t make the cut. The chart separately identifies nations with shares of at least 2%, and on the left, this includes Italy, France, and Taiwan (two of the G7, the UK and Canada, don’t make the cut). In the right panel (value-added basis), the UK makes an appearance with a share just above 2%.
When it comes to gross production, China’s share is three times the US’ share, six times Japan’s, and nine times Germany’s. Taiwan, Mexico, Russia, and Brazil now have higher gross output than the UK. Canada is further down the ranking, in 15th place.
Unprecedented industrialisation
China’s industrialisation is unprecedented. The last time the ‘king of the manufacturing hill’ got knocked off the throne was when the US surpassed the UK just before WW1. It took the US the better part of a century to rise to the top; the China-US switch took about 15 or 20 years. China’s industrialisation, in short, defies comparison.
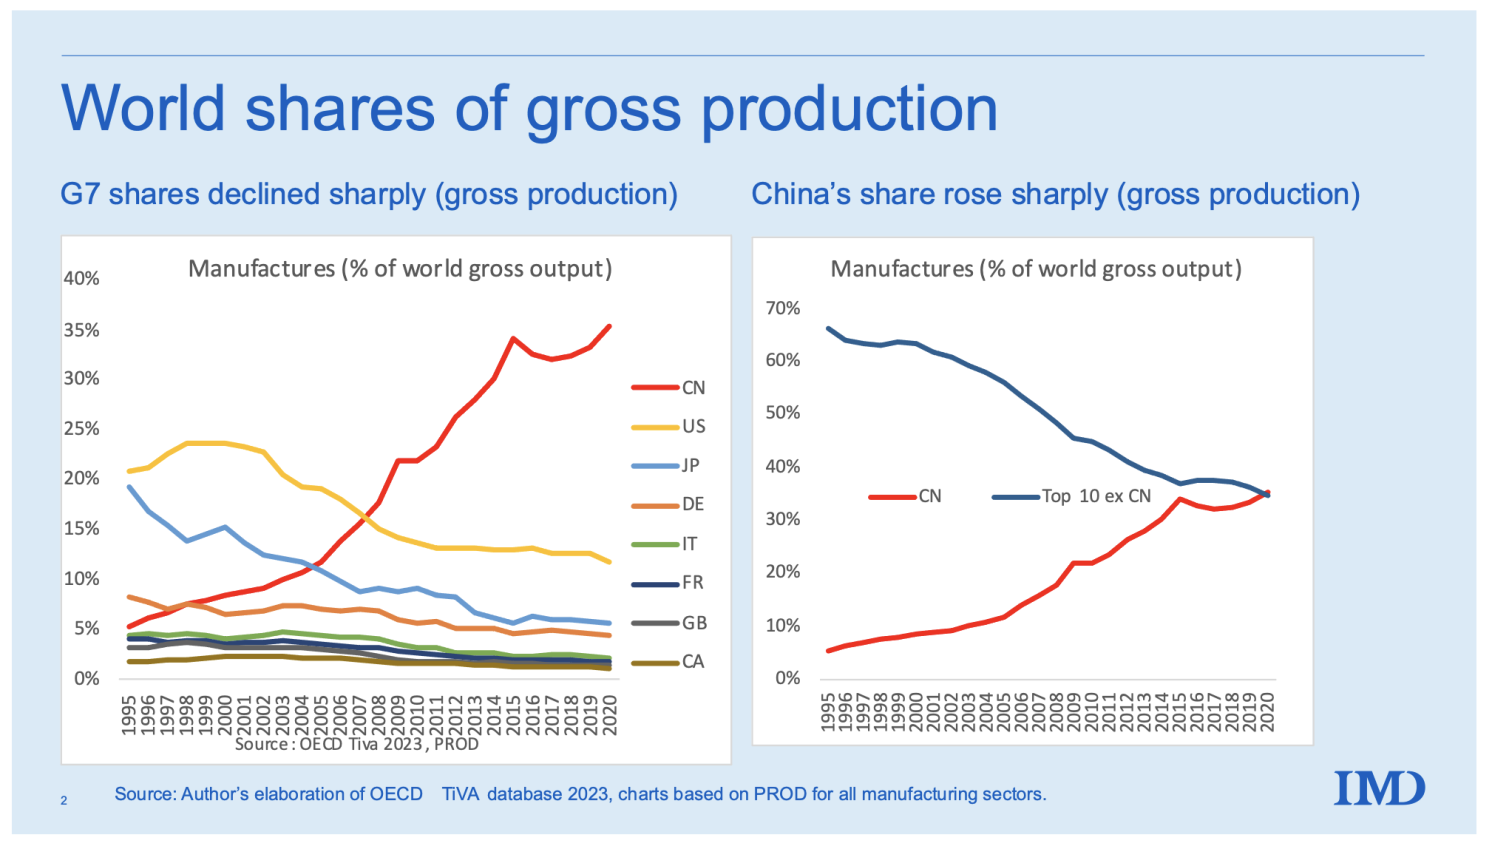
Figure 2 portrays how China dethroned the king of the hill. If we think of this as a 25-lap horserace – one lap per year – all the excitement was in the first 13 laps. Since data only go back to 1995, China started the race a bit ahead of Canada, Britain, France, and Italy. China passed Germany in 1998, Japan in 2005, and the US in 2008. Since then, China has more than doubled its world share while the US’s share has fallen by another three percentage points. If this were a live horserace, boredom would have driven most of the audience away years ago.
The right panel shows that China’s share now exceeds that of the next largest manufacturers combined. This remarkable fact helps us to understand current US-China trade tensions, and the magnitude of supply chain disruptions that occurred when China dialled down its production during Covid. India (not shown separately) was the second fastest share gainer: its global share of manufacturing production rose by two percentage points since 1995.
China’s rise has slowed and looks to have stagnated at about a third of world output. To confirm this, however, we will need more recent data since the last two years in the sample are muddled by events related to the Covid-19 pandemic. The World Bank’s World Development Indicators (WDI) has data to 2022 for value added, and these conform to the flattening narrative, but the WDI do not report gross production data.
Figure 2 China’s meteoric rise in manufacturing, 1995-2020 (world gross production shares) 1
Source: OECD TiVA database, 2023 update.
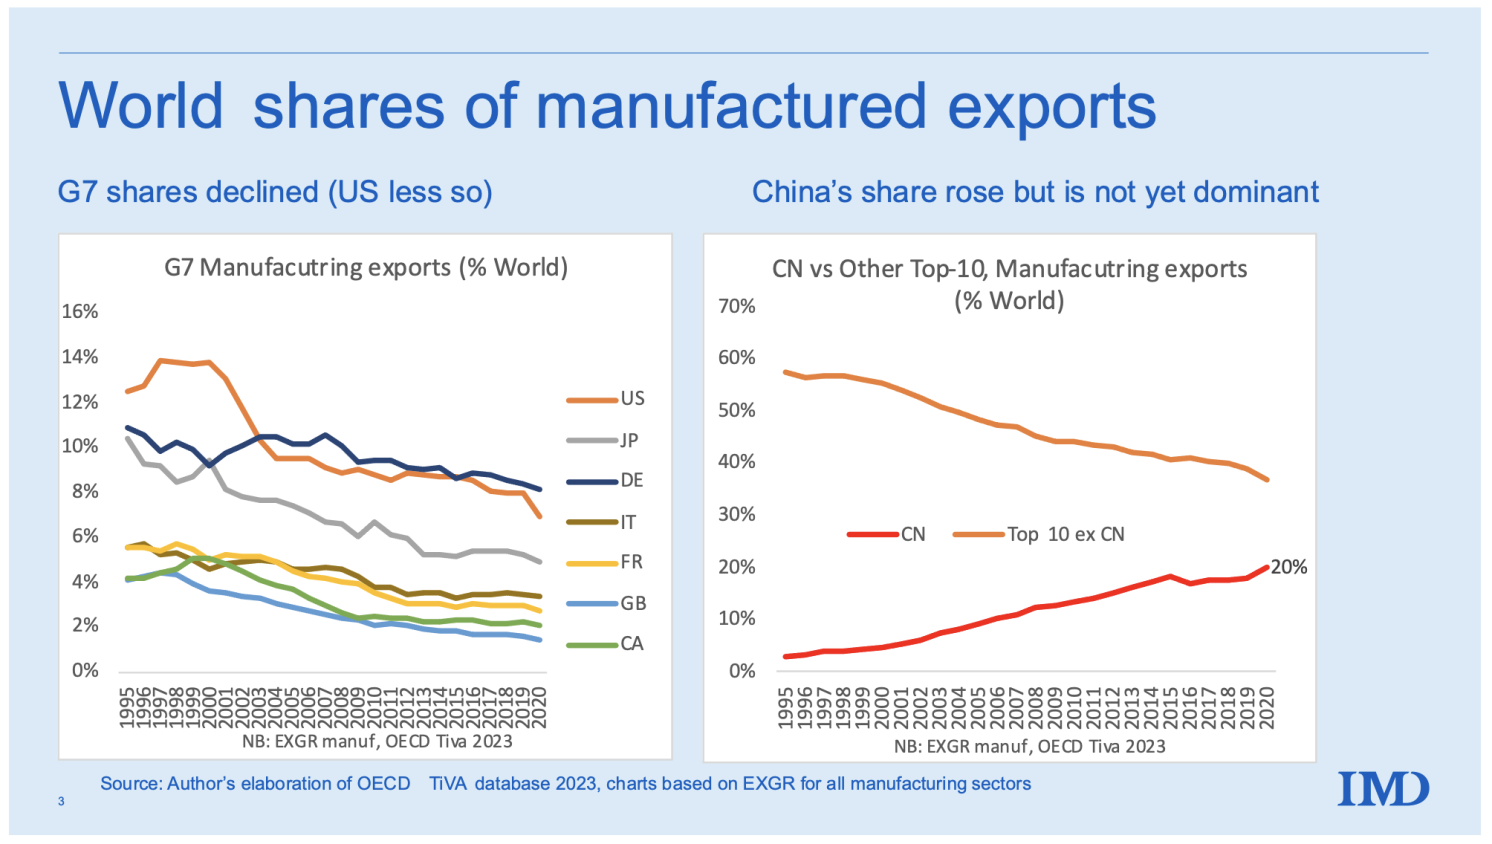
China’s dominance is less stark in exports (Figure 3), though the rise is equally amazing. In 1995 China had just 3% of world manufacturing exports, By 2020, its share had risen to 20%. The corresponding fall in the G7 share was less dramatic than for its share of production. This is explained by the meteoric rise in Chinese domestic consumption, which has absorbed an increasing share of its manufacturing production since 2004. Not shown in the charts is that China’s export to production ratio, having peaked at 18% in 2004, is 13% in 2020 – almost back to its 1995 level of 11%. The same diagrams in the Annex are shown for a value-added basis.
Figure 3 China’s share of world manufacturing exports, 1995-2020
Source: OECD TiVA database.
Asymmetric supply chain exposure: G7 and China
The global supply chain indicators that Rebecca Freeman, Angelos Theodorakopoulos and I developed last year (Baldwin et al. 2022) provide a convenient way of identifying foreign production exposure in supply chains (eight of our new indicators can be found in the TiVA 2023 update). Two of our new indicators are particularly intuitive when it comes to portraying global supply chain exposure.
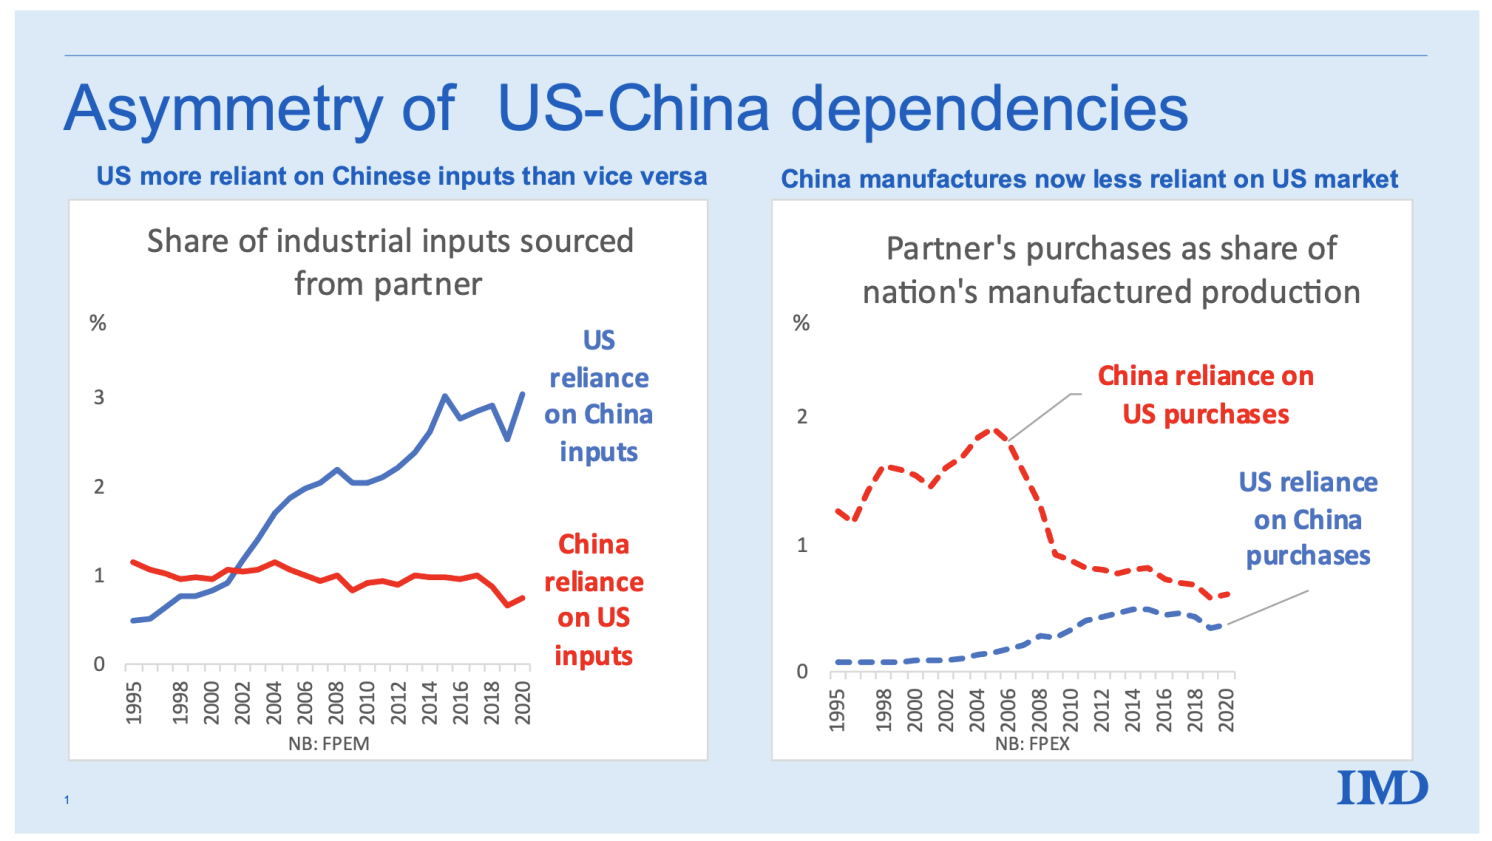
- Foreign Production Exposure: iMport side (FPEM). This shows the share of all industrial inputs (including domestically sourced inputs) that one nation sources from another on a scale of 0 to 100. FPEM accounts for exposure on a look-through basis in the sense that it looks through the suppliers-to-suppliers veil to discover the purchasing nation’s reliance on production in the selling nation.
Figure 4, left panel, shows that the US relies far more on Chinese manufacturing production than vice versa. 2 While shocking at first sight, this should not be unexpected. It is natural that a country with 11% of the world output buys more from a country that produces 35% than vice versa, but the numbers are astounding. China was more exposed to US inputs before 2002, but the US has had greater exposure since then. In 2020, the US was about three times more exposed to Chinese manufacturing production than vice versa.
- Foreign Production Exposure: eXport side (FPEX). This indicator reflects the share of a nation’s gross output of intermediate goods that is exported to a particular partner. It is a measure of exposure on the sales side.
Figure 4, right panel, shows the expected result: China is and always has been more reliant on sales to the US than the other way round. In the mid-2000s, China’s dependence on the US was ten times the reverse dependence, but the asymmetry has narrowed substantially.
Putting together the pieces, this shows a remarkable, historical, world-shaping asymmetry in supply chain reliance between China and other major manufacturing countries. Politicians may wish to decouple their economies from China. These data suggest that decoupling would be difficult, slow, expensive, and disruptive – especially to G7 manufacturers. For explicit estimates, see the simulation studies by Felbermayr et al. (2023) and Goes and Bekkers (2022).
Before closing this chapter on the China rise story, it is important to say that the massive asymmetry has nothing really to do with China. It has to do with China’s superpower standing in manufacturing. To see this, imagine what the charts would look like if they displayed the facts for OPEC and the G7 in the petroleum sector. We would see that the G7 is massively more dependent on OPEC supplies than vice versa. The next chapter of the story redirects the spotlight to the China level.
Figure 4 China and US bilateral FPEM and FPEX, 1995-2020
Source: OECD TiVA database.
China’s balance of trade by sector, supply chain engagement, and openness
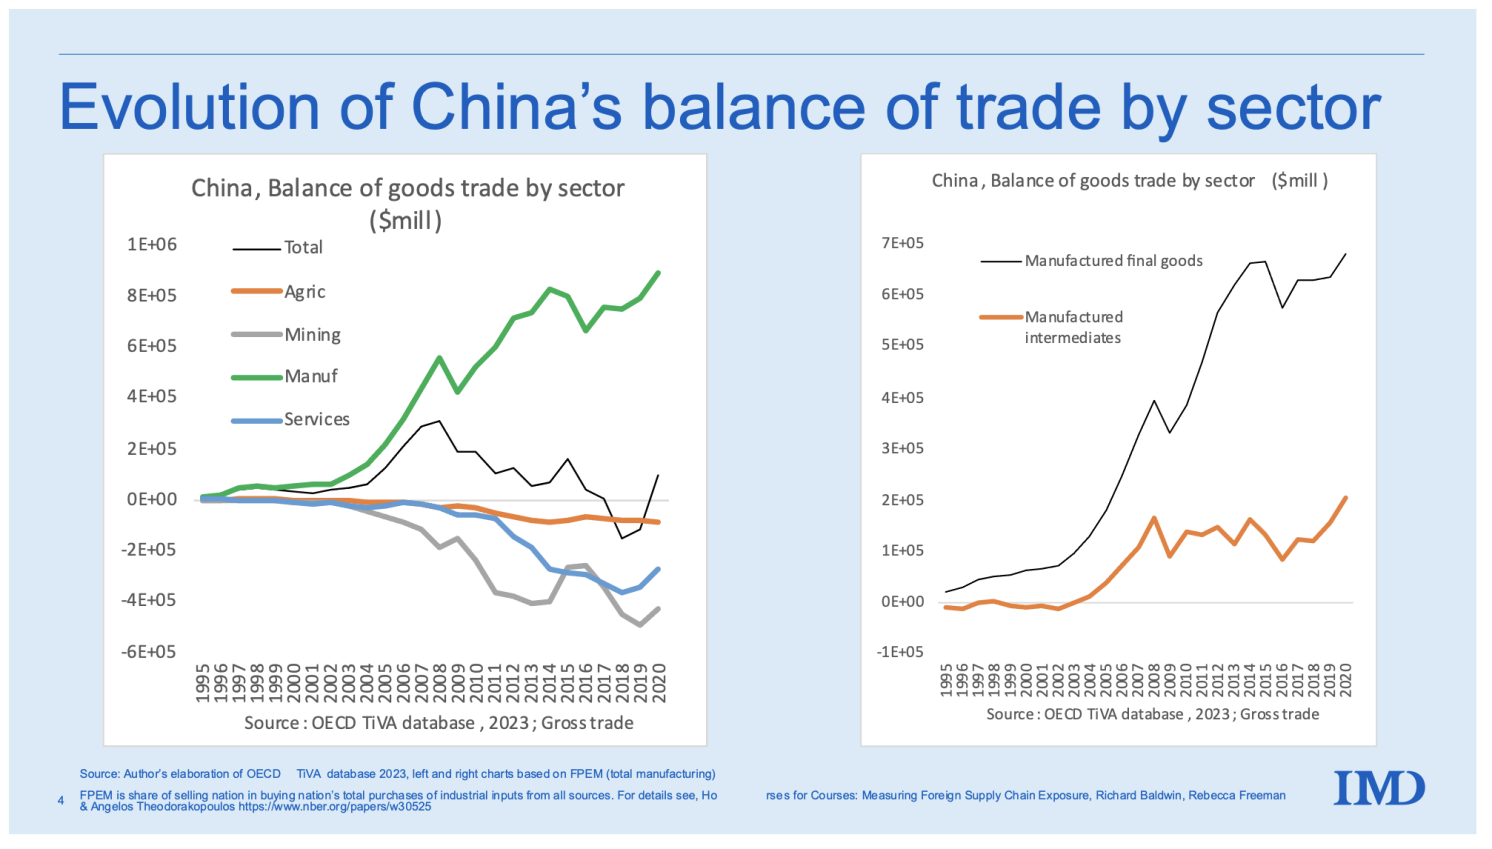
What does the rise to superpower status look like from the shores of China? One convenient, if simplistic, yardstick of a country’s competitive profile is its balance of trade by sector.
The left panel of Figure 5 shows the balance of exports less imports in the major sectors: manufactures, agriculture, mining, and services. The overall trade balance, which is just the sum of the sectoral balances, is shown with the thin black line. The pattern is as clear as it is unsurprising. China is a net exporter of manufactured goods and a net importer of everything else – agriculture goods, mining goods and fuels, and services. Both the positive and negative net balances have been growing quickly. Plainly, China is a big importer and a big exporter. Overall, it ran surpluses in the late 2000s, which then decreased and turned negative in 2018 and 2019 (black line).
The right panel provides important hints about the evolution of China’s manufacturing. It charts the evolution of the country’s net exports of intermediate inputs and final goods. Until the mid-2000s, China was a typical offshore destination: a net importer of intermediate inputs and a net exporter of final goods that embodied the imported inputs. From about 2002, China became a large net exporter of intermediate goods as well as final goods.
Figure 5 Net exports by sector, China, 1995 to 2020
Source: OECD TiVA database.
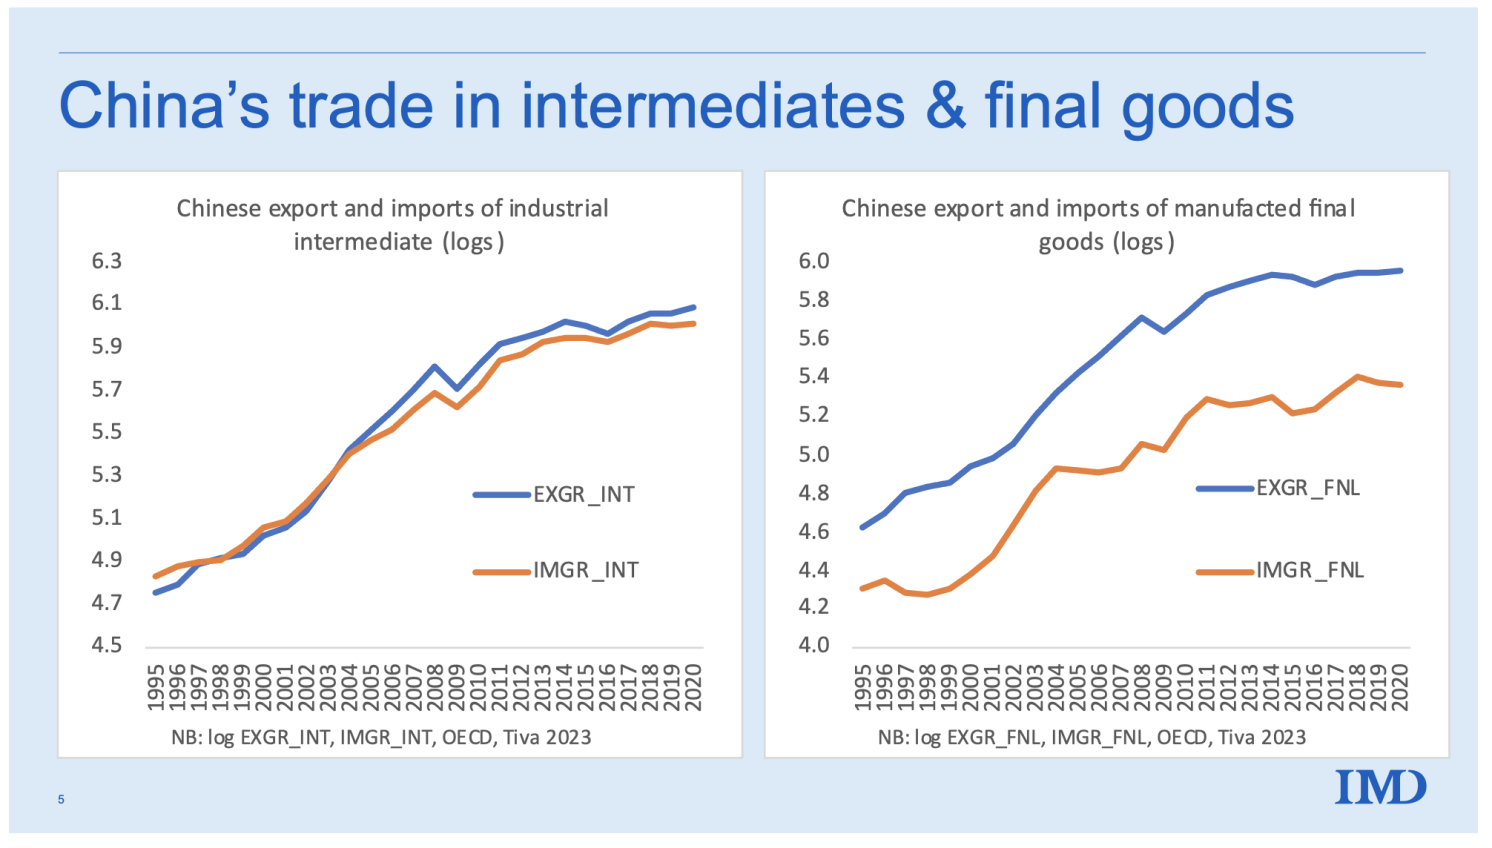
Aggregate balance-of-trade numbers like those in Figure 5 can hide the evolution of the constituent parts. Figure 6, which focuses on manufactured goods, shows exports and imports separately. In the left panel, we can observe that China’s engagement with global supply chains was extremely vigorous until the mid-2000s. Imports and exports of industrial parts and components were growing rapidly, and imports and exports were growing in tandem. Afterward that, exports grew faster, and this difference has produced the positive balance in manufactured goods..
The right panel shows a different picture for final manufactured goods. Here, exports have always exceeded imports, with the imbalance growing rapidly in the 2010s.
Figure 6 Trade in intermediates versus final goods, China, 1995 to 2020
Source: OECD TiVA database.
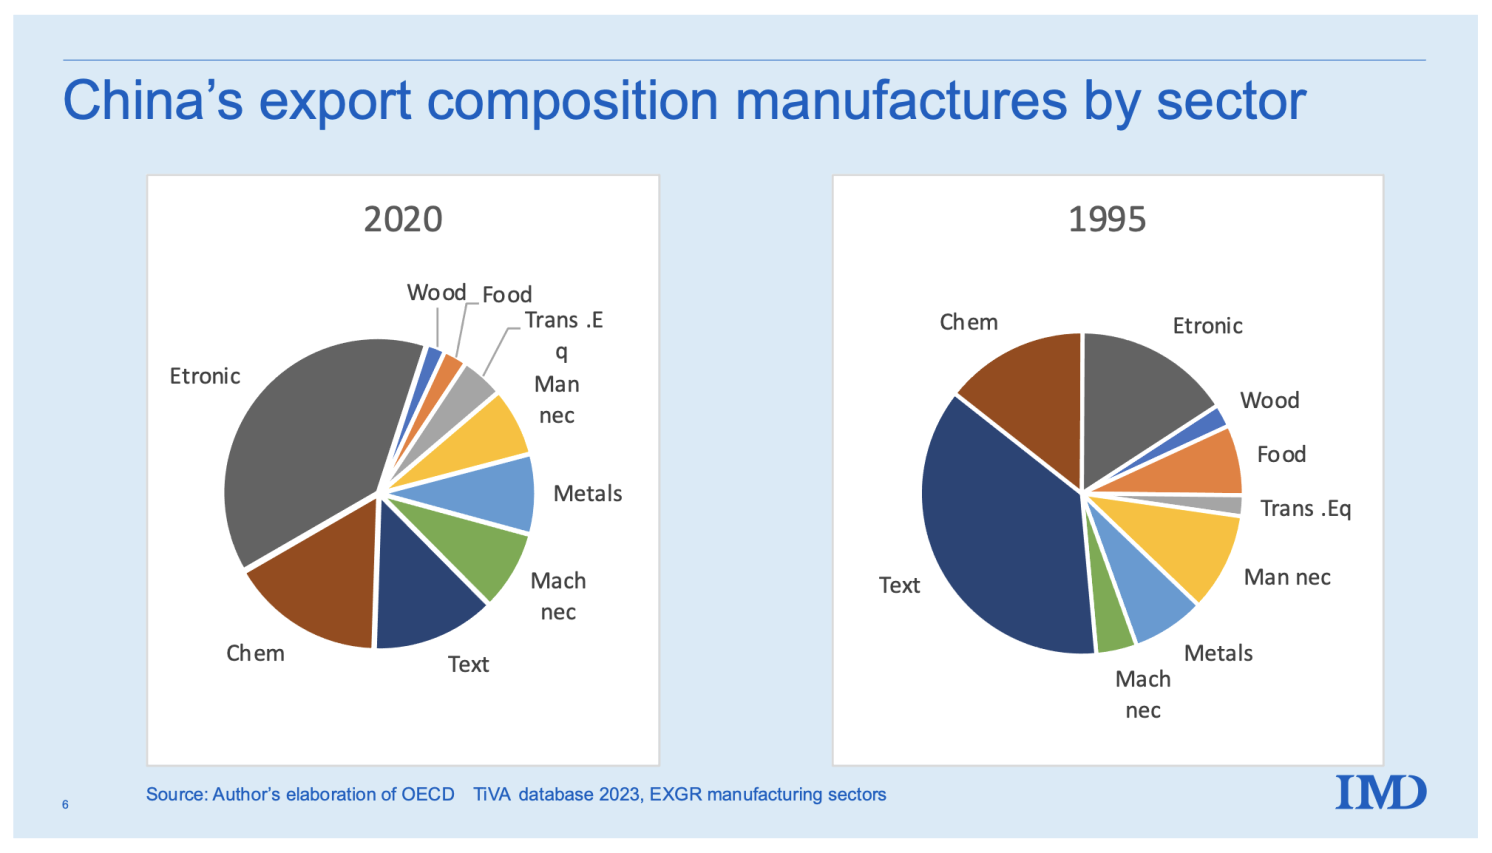
The next pair of charts shows the change in the sectoral composition of China’s exports.
Figure 7 presents the sectoral shares for 1995 (first year in the database) and 2020. It shows that China has moved from being relatively reliant on simple manufacturing sectors like textiles and clothing to more sophisticated sectors like electronics, basic and fabricated metal products, and chemicals and pharmaceuticals. A telling factoid is that textiles accounted for the biggest share in 1995, but electronics did so in 2020.
Figure 7 China’s export basket, 1995 versus 2020
Source: OECD TiVA database.
Globalisation ratio
Finally, consider China’s globalisation ratios (Figure 8). The right panel exhibits the country’s gross globalisation ratio (GGR) in manufacturing. This is the share of manufactured production that is sold abroad, where production is measured as the total sales of all China-based manufacturers. It differs from manufacturing GDP since it includes all sales, not just final good sales.
Turning to the facts, we see that during its rise to manufacturing superpower status, China’s GGR rocketed up – almost doubling – in the first decade of the data. Indeed, most of the action came between 1999 and 2004. That period was an extraordinary feat of globalisation, and it is probably why so many think of China as an economy that is incredibly dependent on exports. But the story doesn’t end in 2004.
Since 2004, China’s GGR has been falling steadily. And don’t miss the fact that it is, in 2020, not far above where it started in 1995. Chinese manufacturing, in short, is no longer as dependent on exports as many might believe. True, the first part of the rapid growth period involved exports growing faster than production (so the GGR rises). But then production grows faster than exports, implying that domestic sales were becoming relatively more important, compared to export sales – even though domestic and foreign sales were both booming throughout the high-growth episode. This dispels the myth that China’s success can be entirely attributed to exports. From around 2004, China increasingly became its own best customer.
The takeaway is simple: China’s openness, as measured by the GGR, has fallen rapidly. By 2020 it was only slightly more dependent on export sales than it was 1995.
Figure 8 China’s manufacturing growth and Gross Globalisation Ratio (GGR)

Source: OECD TiVA database.
Concluding remarks
China is now the world’s sole manufacturing giant. As its recent success in electric vehicles demonstrates, its wide and deep industrial base can help it gain a competitive edge in virtually all sectors. The exceptions are the most advanced sectors, where the G7 countries still dominate.
Politicians who indulge in loose talk about decoupling from China need a clear-eyed look at the facts. As we have shown (Baldwin et al. 2023), all the major manufacturers in the world source at least 2% of all their industrial inputs from China. Decoupling would be difficult, to say the least.
References
Baldwin, R, R Freeman and A Theodorakopoulos (2022), “Horses for Courses: Measuring Foreign Supply Chain Exposure”, NBER Working Paper w31820.
Baldwin, R, R Freeman and A Theodorakopoulos (2023), “Hidden Exposure: Measuring Us Supply Chain Reliance”, NBER Working Paper w31820 (forthcoming in Brookings Paper on Economic Activity).
Felbermayr, G, H Mahlkow and A Sandkamp (2023), “Cutting through the value chain: the long-run effects of decoupling the East from the West”, Empirica 50: 75–108.
Góes, C and E Bekkers (2022), “The impact of geopolitical conflicts on trade, growth, and innovation”, WTO Staff Working Paper ERSD-2022-09.
Ranganathan, T C A (2023), “What really made China the manufacturing superpower?”, Deccan Herald.
Wang, T (2023), Making Sense of the Chinese Economy, Routledge.
World Bank and People’s Republic of China Development Research Center of the State Council (2013), “China 2030: Building a Modern, Harmonious, and Creative Society”, The World Bank Group, No. 12925.
Annex
Figure A1 China’s share of world manufacturing GDP, 1995-2020

Source: OECD TiVA database.
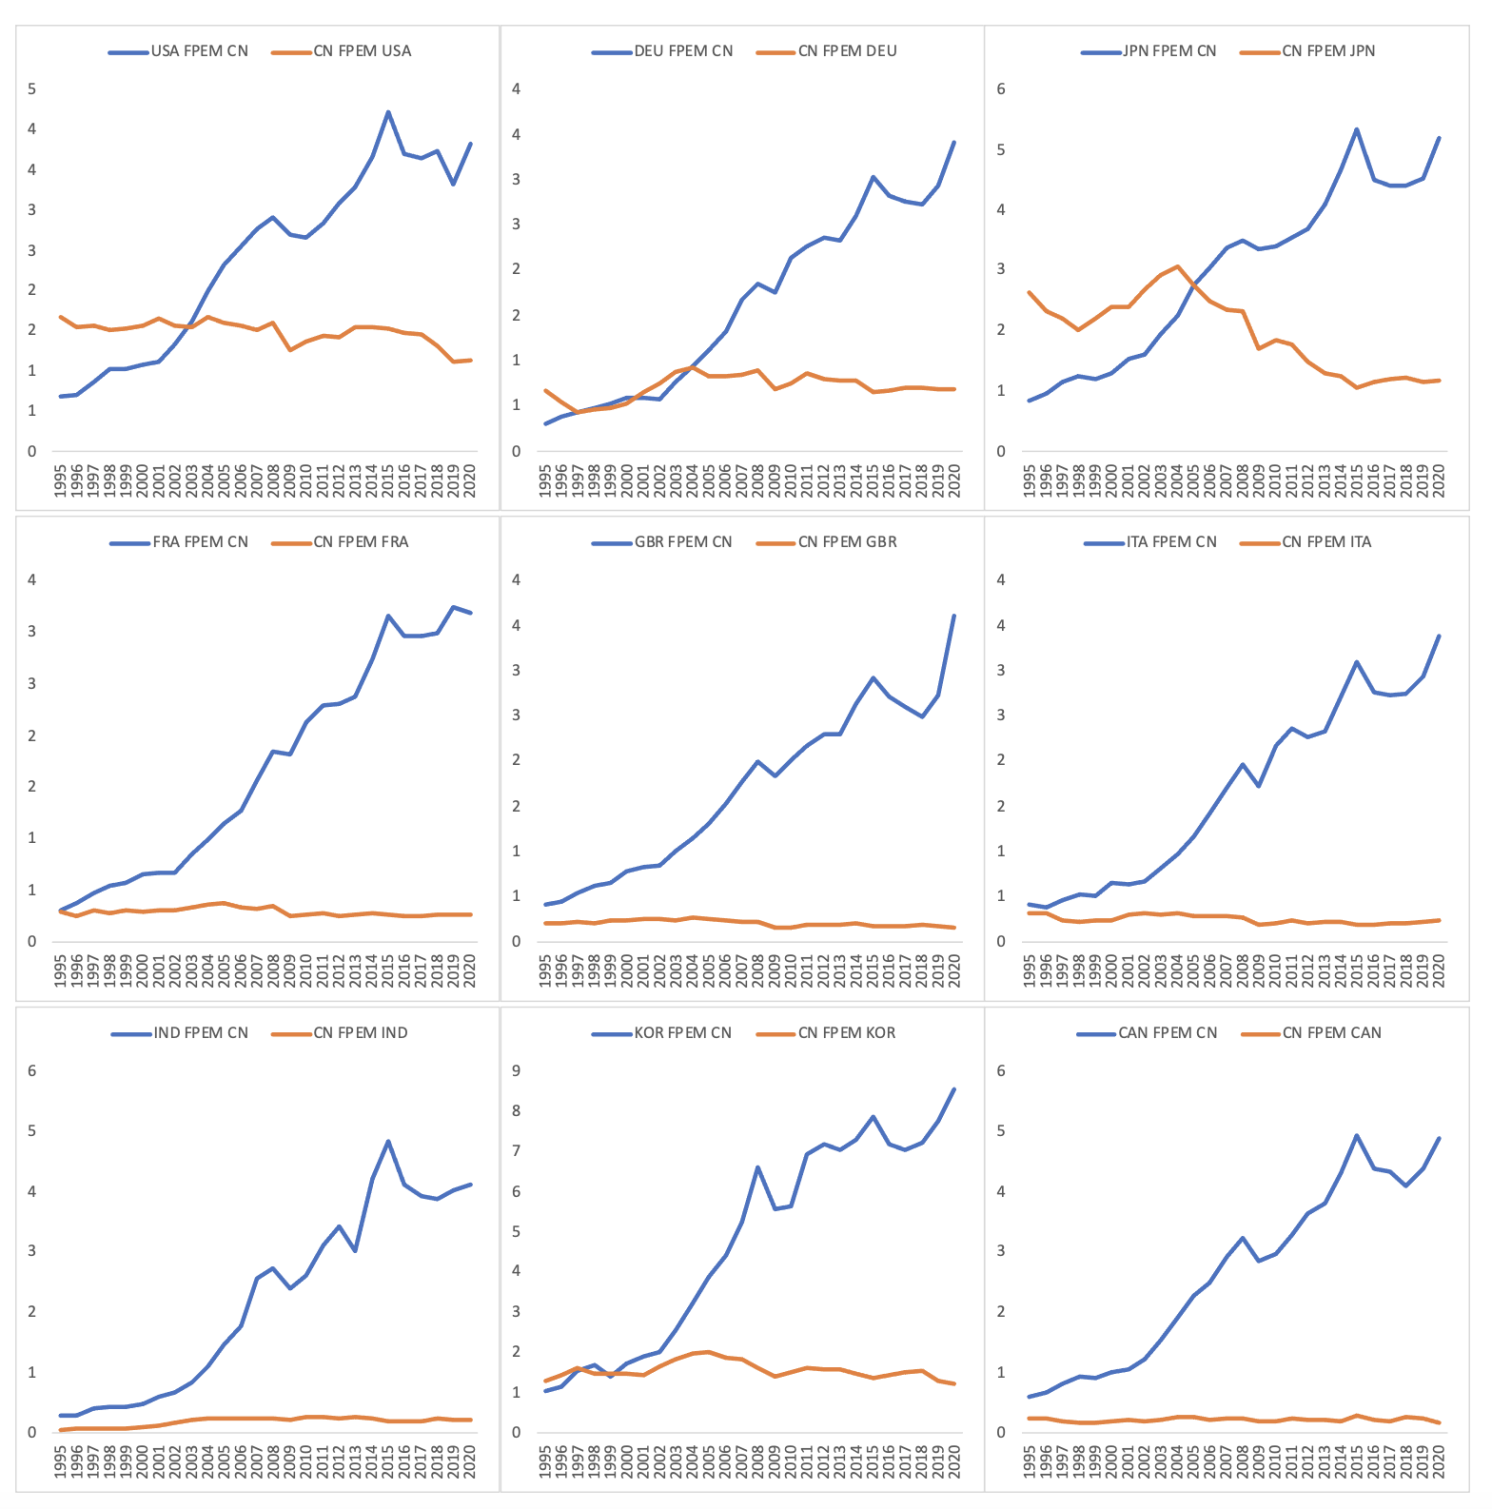
Figure A2 Asymmetric supply chain reliance (FPEM): G7, India, and Korea, 1995-2020
Source: OECD TiVA database.
Footnotes
- Figure A1 in the Annex shows the shares from a value-added perspective. The G7 decline in manufacturing value added has been less brutal than it was in gross production, and the US’s value-added share has risen slightly since 2010. Recall that gross output is the total sales of manufactured goods while value added is this minus the value of intermediate inputs. This is why China’s dominance is less marked in value-added terms since it has specialized in sectors, like electronics, that are especially intensive in the use of intermediate inputs (so their gross production exceeds their value added by a margin that is unusual by world standards). Likewise, China's world manufacturing GDP share is less dominant than its production share, but it is still dominant. In 2020, for instance, its share was almost twice that of the US and four times larger than Japan’s.
- Figure A2 shows this FPEM insight applies to other G7 nations, as well as India and South Korea.
- xxxxxxxxxxxxxxxxxxxxxxxxxxxxxxxxxxxx
- NB NOTE - Unable to copy Article number 3 into Blogger https://jwsr.pitt.edu/ojs/jwsr/article/view/1221/1628
- xxxxxxxxxxxxxxxxxxxxxxxxxxxxxxxxxxxxxxxxxxxx
No comments:
Post a Comment